
A Foundational Guide by Monalytics,
Everything you need to understand the framework behind our analysis.
Introduction
At MOnalytics, every market analysis we publish is built on one framework: The Elliott Wave Theory. It allows us to move beyond reactive commentary and into structured, forward-looking market interpretation — identifying not just where the market is, but what it is most likely to do next.
This guide exists so you can follow our work. You do not need to be a practitioner. But understanding the core principles of Elliott Wave will fundamentally change how you read every chart, forecast, and trade setup we share.
What Is the Elliott Wave Theory?
The Elliott Wave Theory is a method of technical analysis that identifies recurring, fractal wave patterns in financial market prices. It attributes those patterns to the collective psychology of market participants — the cyclical oscillation between optimism and fear that shapes price action across every asset class and every timeframe.
The theory holds that any trending market moves in a repeating cycle of eight waves: five in the direction of the primary trend (impulse waves), followed by three against it (corrective waves). This 5-3 structure repeats at every scale simultaneously — a property known as fractal self-similarity. The same pattern visible on a monthly chart is embedded within each segment of a daily chart, and within each segment of that.
Origin
Ralph Nelson Elliott (1871–1948) was an American accountant who, during a prolonged illness in the early 1930s, spent years studying 75 years of stock market data. His finding was direct: markets do not move randomly. They follow a repeating cycle of human emotion that leaves the same structural signature on price charts regardless of the asset or timeframe. He published his findings in 1938 in The Wave Principle.
The work remained within specialist circles until 1978, when Robert Prechter and A.J. Frost published thye book "The Elliott Wave Principle" — applying the framework to forecast the great bull market of the 1980s with considerable accuracy. That book brought the theory into mainstream technical analysis and remains the definitive text on the subject.
How It Works
The mechanics are grounded in a simple observation: investor sentiment moves in identifiable, repeating cycles. During impulse waves, confidence builds progressively, drawing in wider market participation at each stage. During corrective waves, doubt or consolidation pulls prices back before the next leg begins.
The theory does not depend on news or fundamentals. It holds that price movement is determined by the underlying wave structure — and that news simply provides a narrative investors attach to a move already in progress. This is why Elliott Wave analysis can frame an expectation before a catalyst is known.
publicly known.
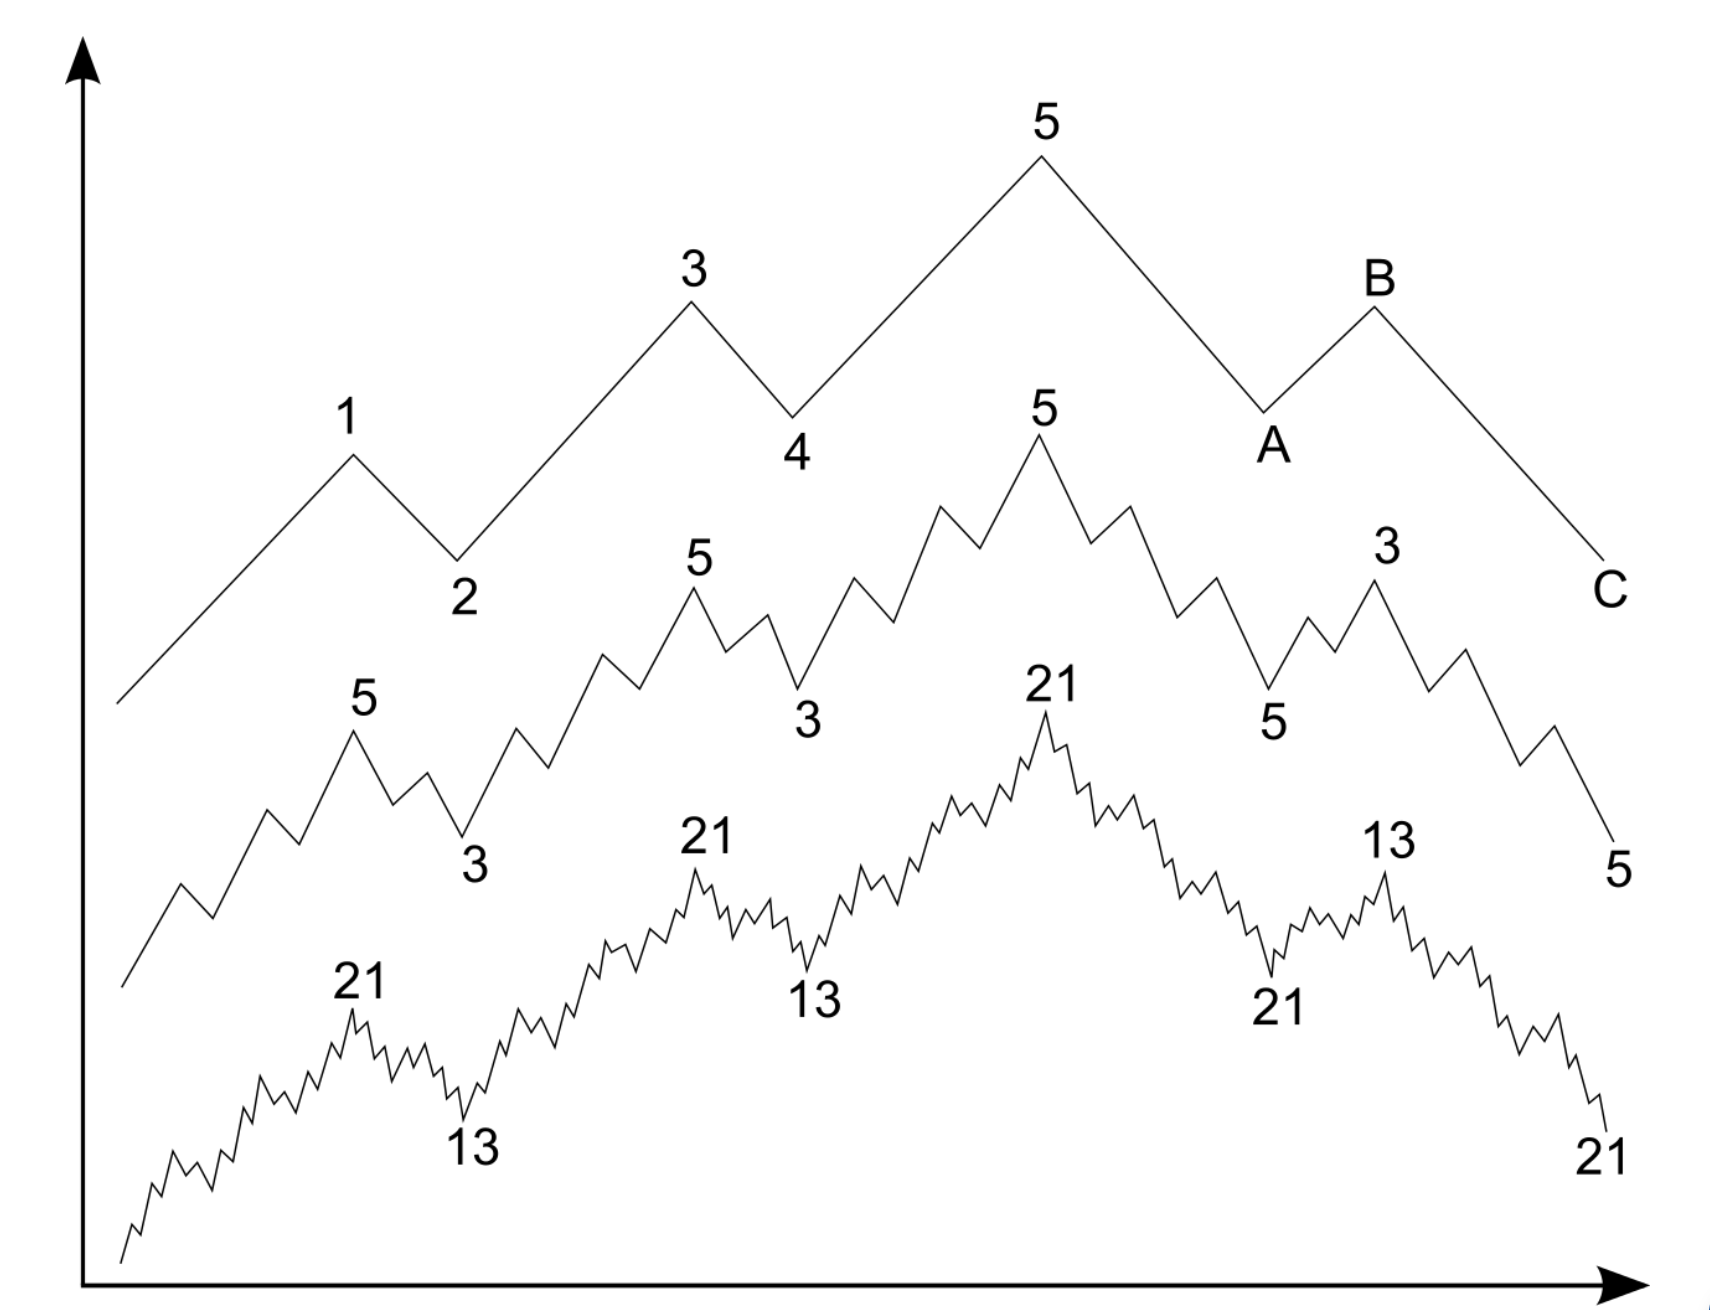
The most powerful property of the theory — and the one that takes a moment to really sink in — is self-similarity across scales. A Wave 3 on a weekly chart contains its own five-wave impulse at the daily level. That daily Wave 3 subdivides again on the hourly chart. The diagram below shows exactly that: the numbers on each layer (5, 3, 21, 13...) are Fibonacci numbers, reflecting how the fractal nesting works in practice.

The Wave Framework
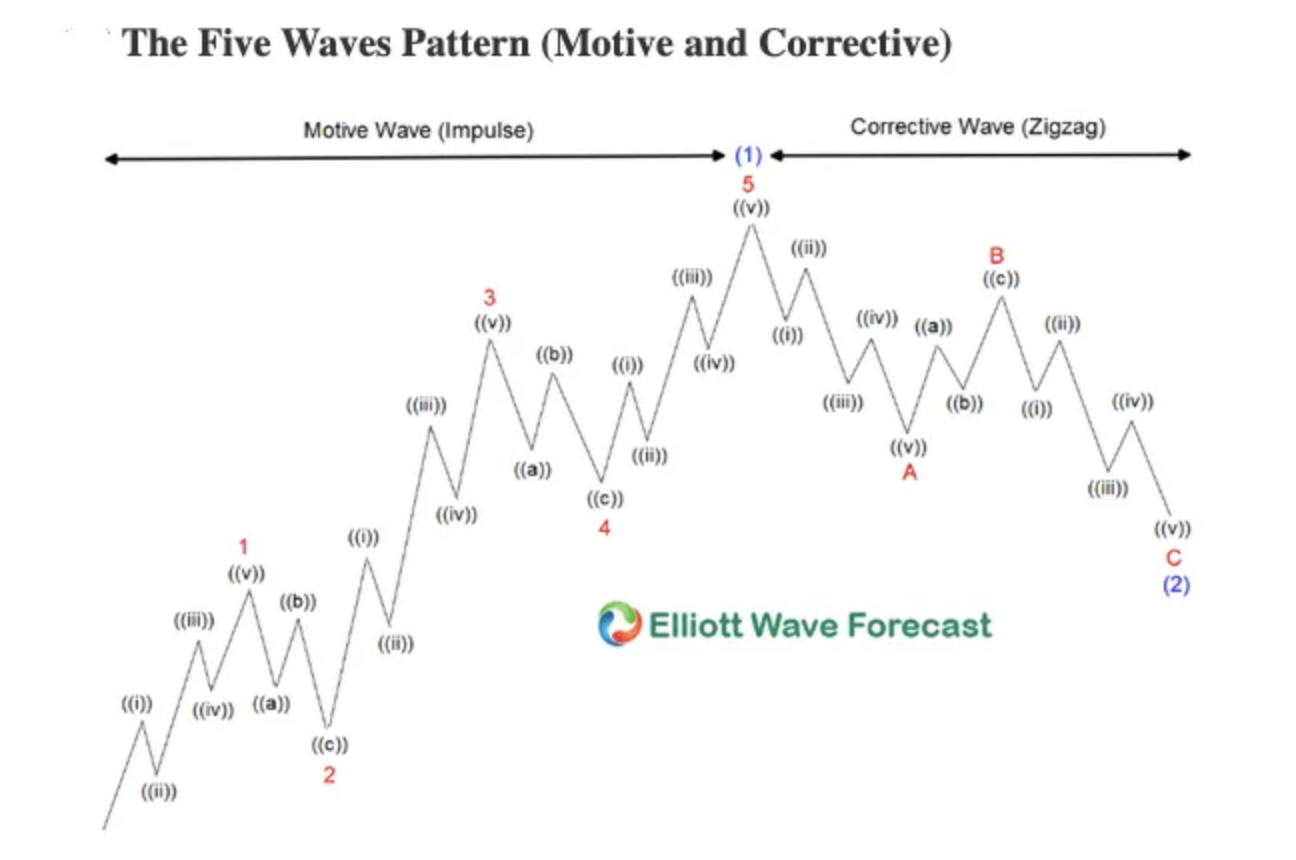
Every complete market cycle has two phases: a motive phase of five waves, followed by a corrective phase of three waves. The diagram below shows both phases side by side — including how each wave subdivides at the next degree down.
Motive Phase — Five Impulse Waves
- Waves 1, 3 & 5 move in the direction of the trend — the forward legs of the cycle.
- Waves 2 & 4 move against the trend as partial retracements. They reset sentiment before the next push begins — they're part of the structure, not a threat to it.
Two waves carry particular weight:
- Wave 3 is usually the strongest wave in the cycle — highest volume, widest price range, strongest momentum. It's where the move becomes broadly accepted and where positioning tends to matter most.
- Wave 5 often shows weakening momentum even as price makes new highs. RSI and MACD divergence here is a classic warning sign that the motive phase is running out of fuel.
Corrective Phase — Three Waves (A-B-C)
Once the motive phase ends, the market corrects the excess through three waves:
- Waves A & C are the corrective legs — they push against the prior trend and do the actual unwinding.
- Wave B is a temporary counter-move in the direction of the prior trend. It's one of the most misread signals in the entire framework — it looks like the trend is resuming, but it isn't. Getting Wave B right is one of the things that separates solid analysis from bad calls.
Corrections don't all look the same. They come in three main shapes — zigzags (sharp, fast), flats (sideways, grinding), and triangles (converging, contracting). Each has its own internal structure and different implications for what follows.
The Three Rules
Elliott Wave analysis is governed by three structural rules. These are not conventions — they are hard constraints. If any one is violated, the wave count is invalid and must be re-labelled from scratch.
Rule 1: Wave 2 never retraces more than 100% of Wave 1
- Wave 2 corrects Wave 1 but cannot close below its origin. A break below invalidates the entire prior count of Wave 1.
Rule 2: Wave 3 is never the shortest impulse wave
- Among Waves 1,3 and 5, Wave 3 cannot be simultaneously shorter than both others. In practice it is almost always the longest and strongest.
Rule 3: Wave 4 never enters Wave 1 price territory
- In a standard impulse, the low of Wave 4 must remain above the high of Wave 1. The only exception is within certain diagonal trinagle formations.
These rules are what keep the framework honest. When a count breaks one of them, the problem is in the analysis — not in the market.
Fibonacci Mathematics
Elliott Wave and Fibonacci are inseparable. The proportional relationships Elliott observed between waves map directly onto the Fibonacci sequence and its ratios — particularly 0.618 and 1.618, the Golden Ratio and its inverse. These ratios aren't a coincidence; they reflect the same geometric proportions found throughout nature.
In our analysis, Fibonacci does two jobs. Retracement levels show where corrective waves are likely to end — the zones we define for accumulation or entries. Extension levels project where impulse waves are likely to target — the price zones we use for exits and target projections.
Application | Key Levels |
Retracement — where corrective waves likely end | 0.382 · 0.500 · 0.618 · 0.786 |
Extension — where impulse waves likely target | 1.000 · 1.272 · 1.618 · 2.618 |
Most significant ratio | 0.618 / 1.618 — the Golden Ratio |
Fibonacci levels mark zones, not exact prices. A wave count that aligns with a key Fibonacci ratio carries more confidence — but no ratio is a guarantee. It adds probability to the picture, nothing more.
Limitations
No serious practitioner presents Elliott Wave Theory without acknowledging its limitations. Understanding them is part of using the framework properly.
- Subjectivity — Wave counting involves interpretation. Different analysts can produce different valid counts for the same chart. Experience, discipline, and strict rule adherence are what separate reliable analysis from speculation.
- Hindsight bias — Patterns are often clearer in retrospect than in real time. Identifying the correct count while it is still forming is harder — and is precisely the skill that experienced practitioners develop.
- Invalidation risk — A count can be invalidated at any point. This is not a weakness — it is a built-in feature. Invalidation levels are predefined risk parameters, not surprises.
- Not a standalone system — Elliott Wave is most effective when combined with volume analysis, momentum indicators, and broader market context. We treat it as the primary structural framework, not the only input.
- Exogenous events — Unexpected macroeconomic shocks can disrupt wave structures, particularly on shorter timeframes. The structure typically reasserts itself — but the near-term count may require revision.
The most respected practitioners — including Robert Prechter and Glenn Neely — consistently describe the theory as a probabilistic framework, not a deterministic one. Its value lies in structuring risk and defining clear invalidation levels before a position is taken.
How This Applies to Our Work
Every analysis MOnalytics publishes states the active wave count, the next expected move, and the level at which that count is invalidated. That structure only makes sense if you understand the framework behind it — which is why this guide exists.
We also publish a separate trading guide covering how to apply our wave counts directly to trade setups: entry logic, stop placement, and target projection based on the structure. That is the natural next step once you are comfortable with the fundamentals here. Using Bitcoin as an example, we show how we count and analyse an asset at MOnalytics and how we approach our trading strategy.
Kind regards,
MOnalytics
DISCLAIMER: The content on this website, including charts, analyses, and recommendations, is for informational purposes only and does not constitute financial, investment, or professional advice. Trading and investing involve risk. You should consult a qualified financial advisor before making any investment decisions.