This was a clear success — we are now officially deactivating our defined Fibonacci buying zone.
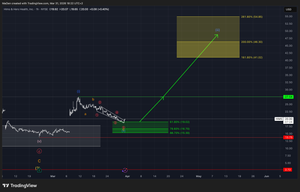
The chart shown at the beginning of this post is the same one we previously shared, when Tilray reached and activated our defined Fibonacci retracement zone. At that time, we identified this area as a clear buying or accumulation opportunity.
With the setup now having played out successfully, we are officially deactivating this zone.
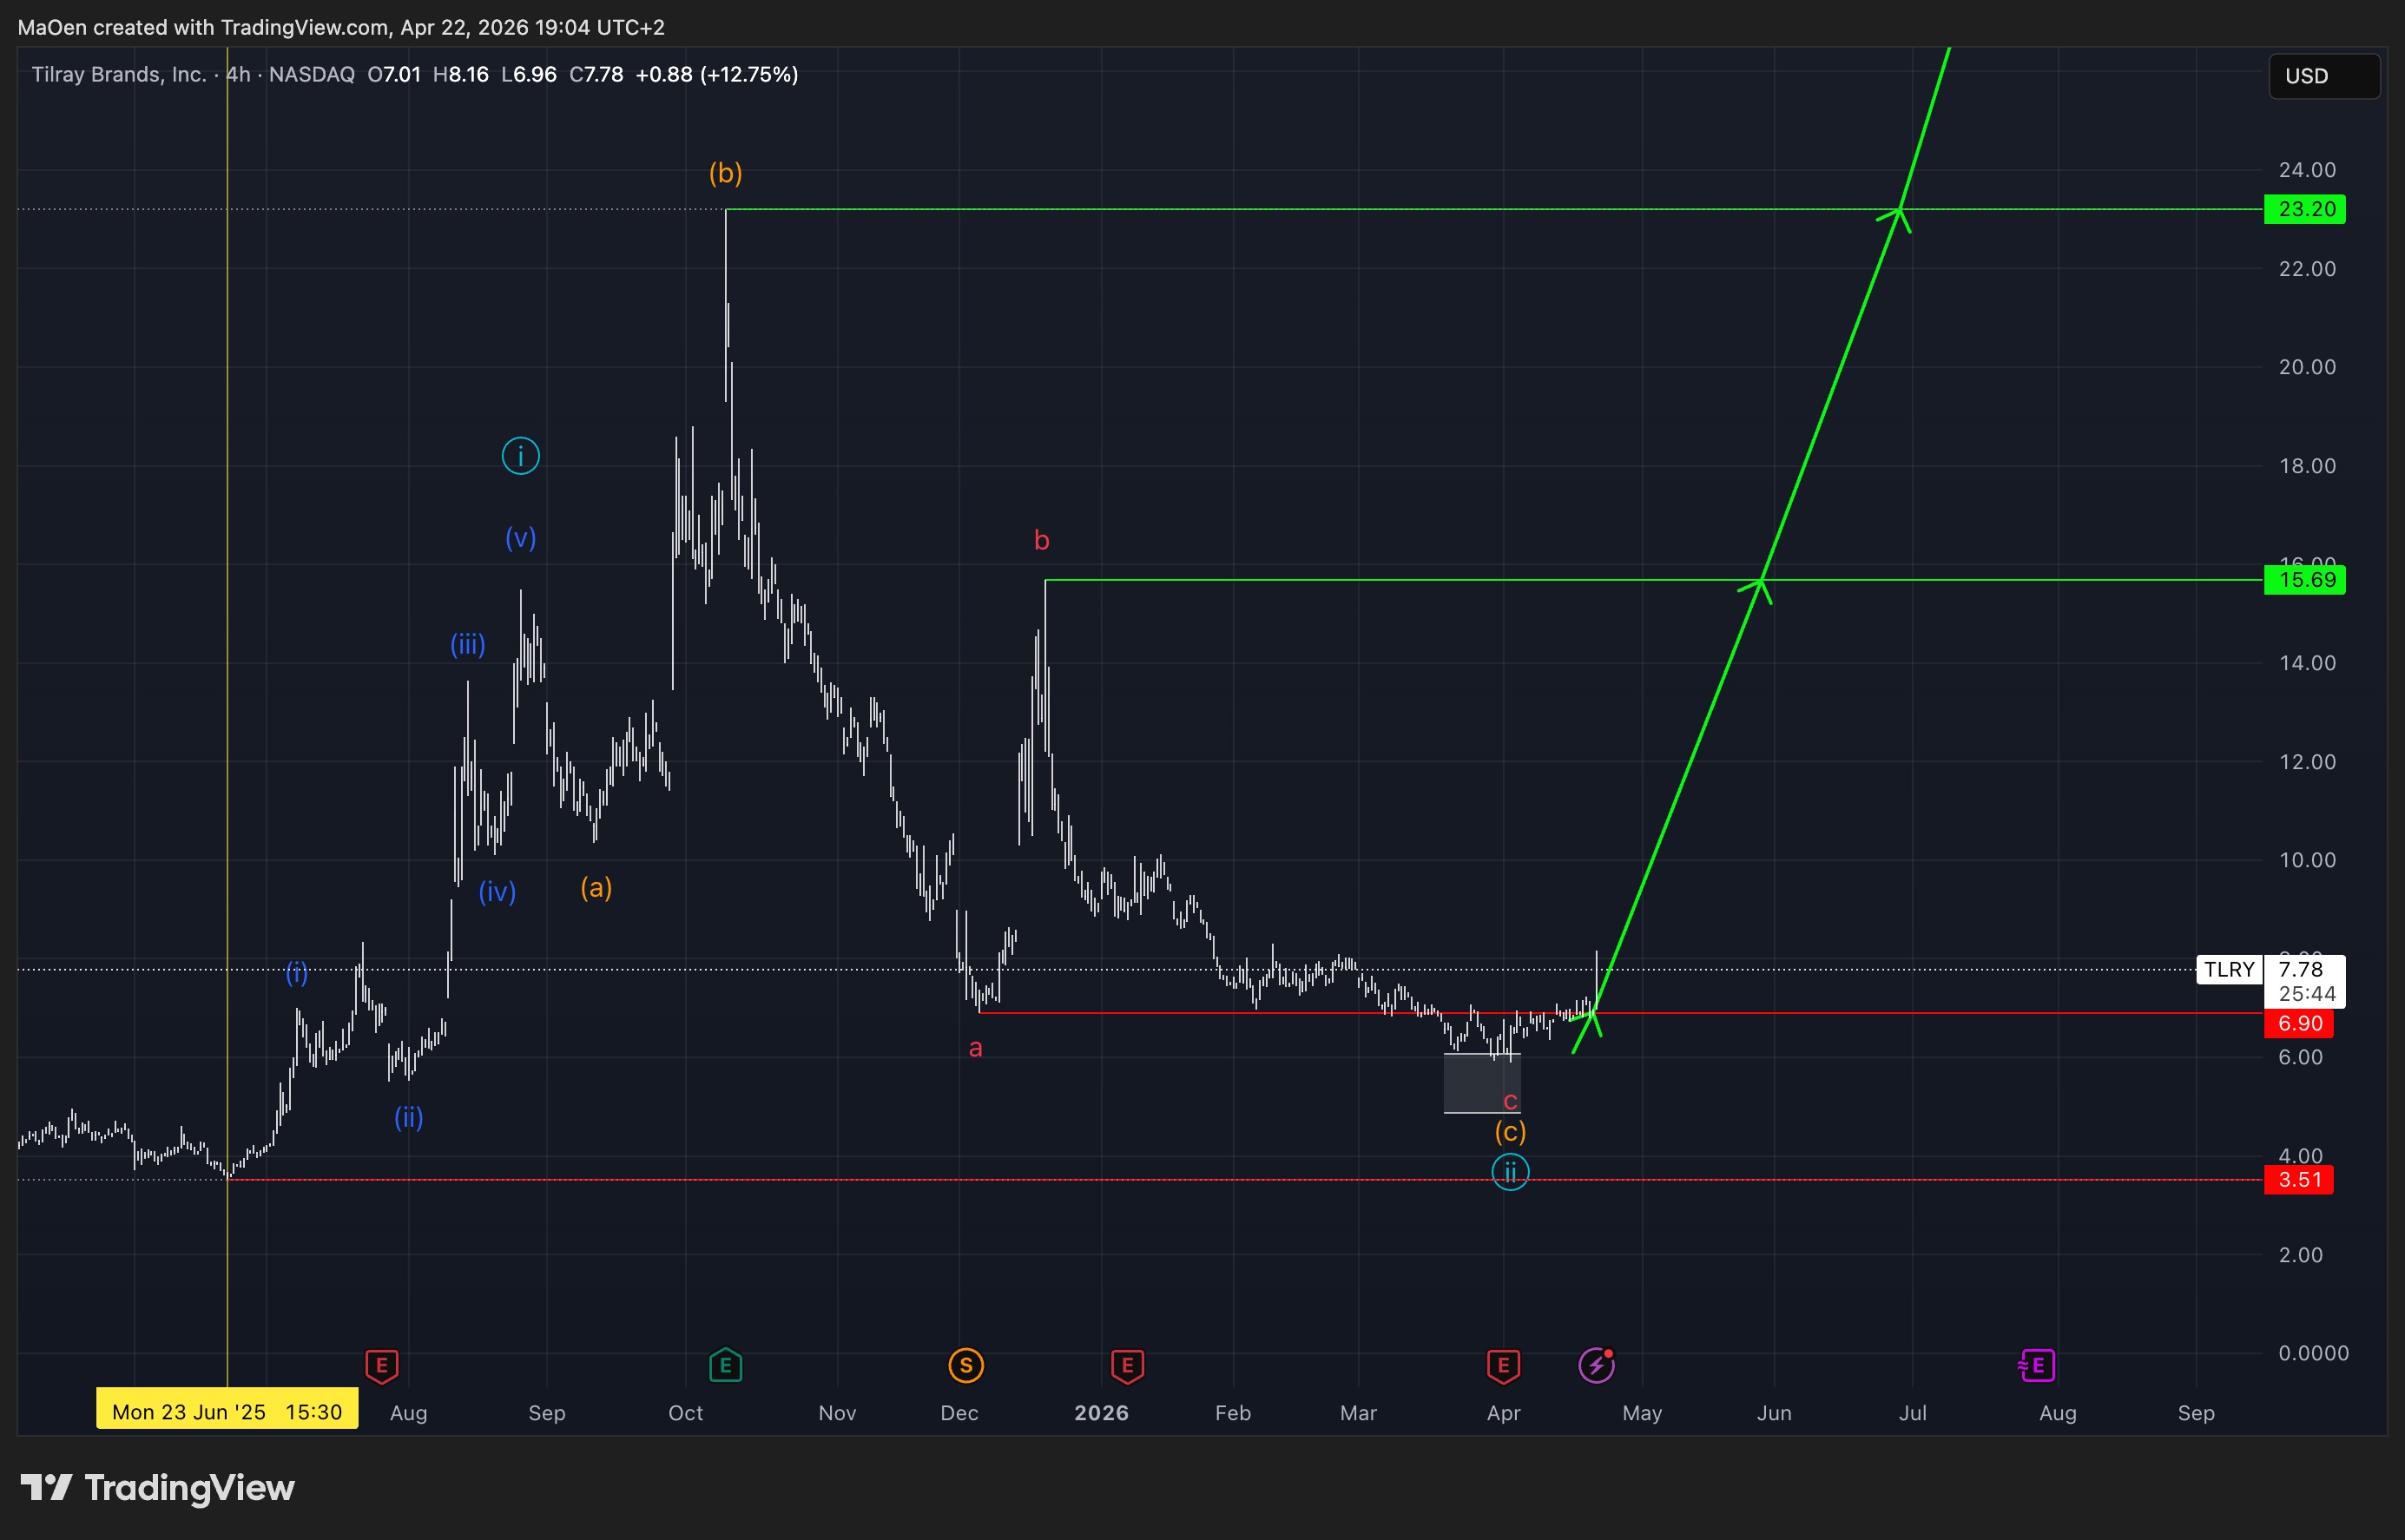
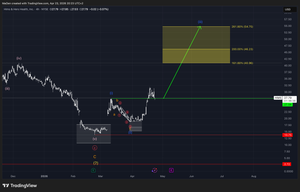
This chart shows the current price action of Tilray. We have now deactivated the Fibonacci retracement zone (grey area), as Tilray has successfully moved out of this zone to the upside, exactly as expected.
If you entered at the upper boundary of the zone — around the 78.6% level at $6.08 — you should currently be up approximately 34%. This trade has played out exceptionally well.
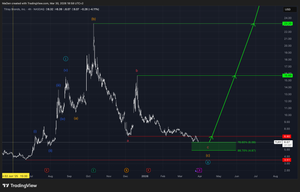
From here, we expect the stock to continue following its long-term outlook.
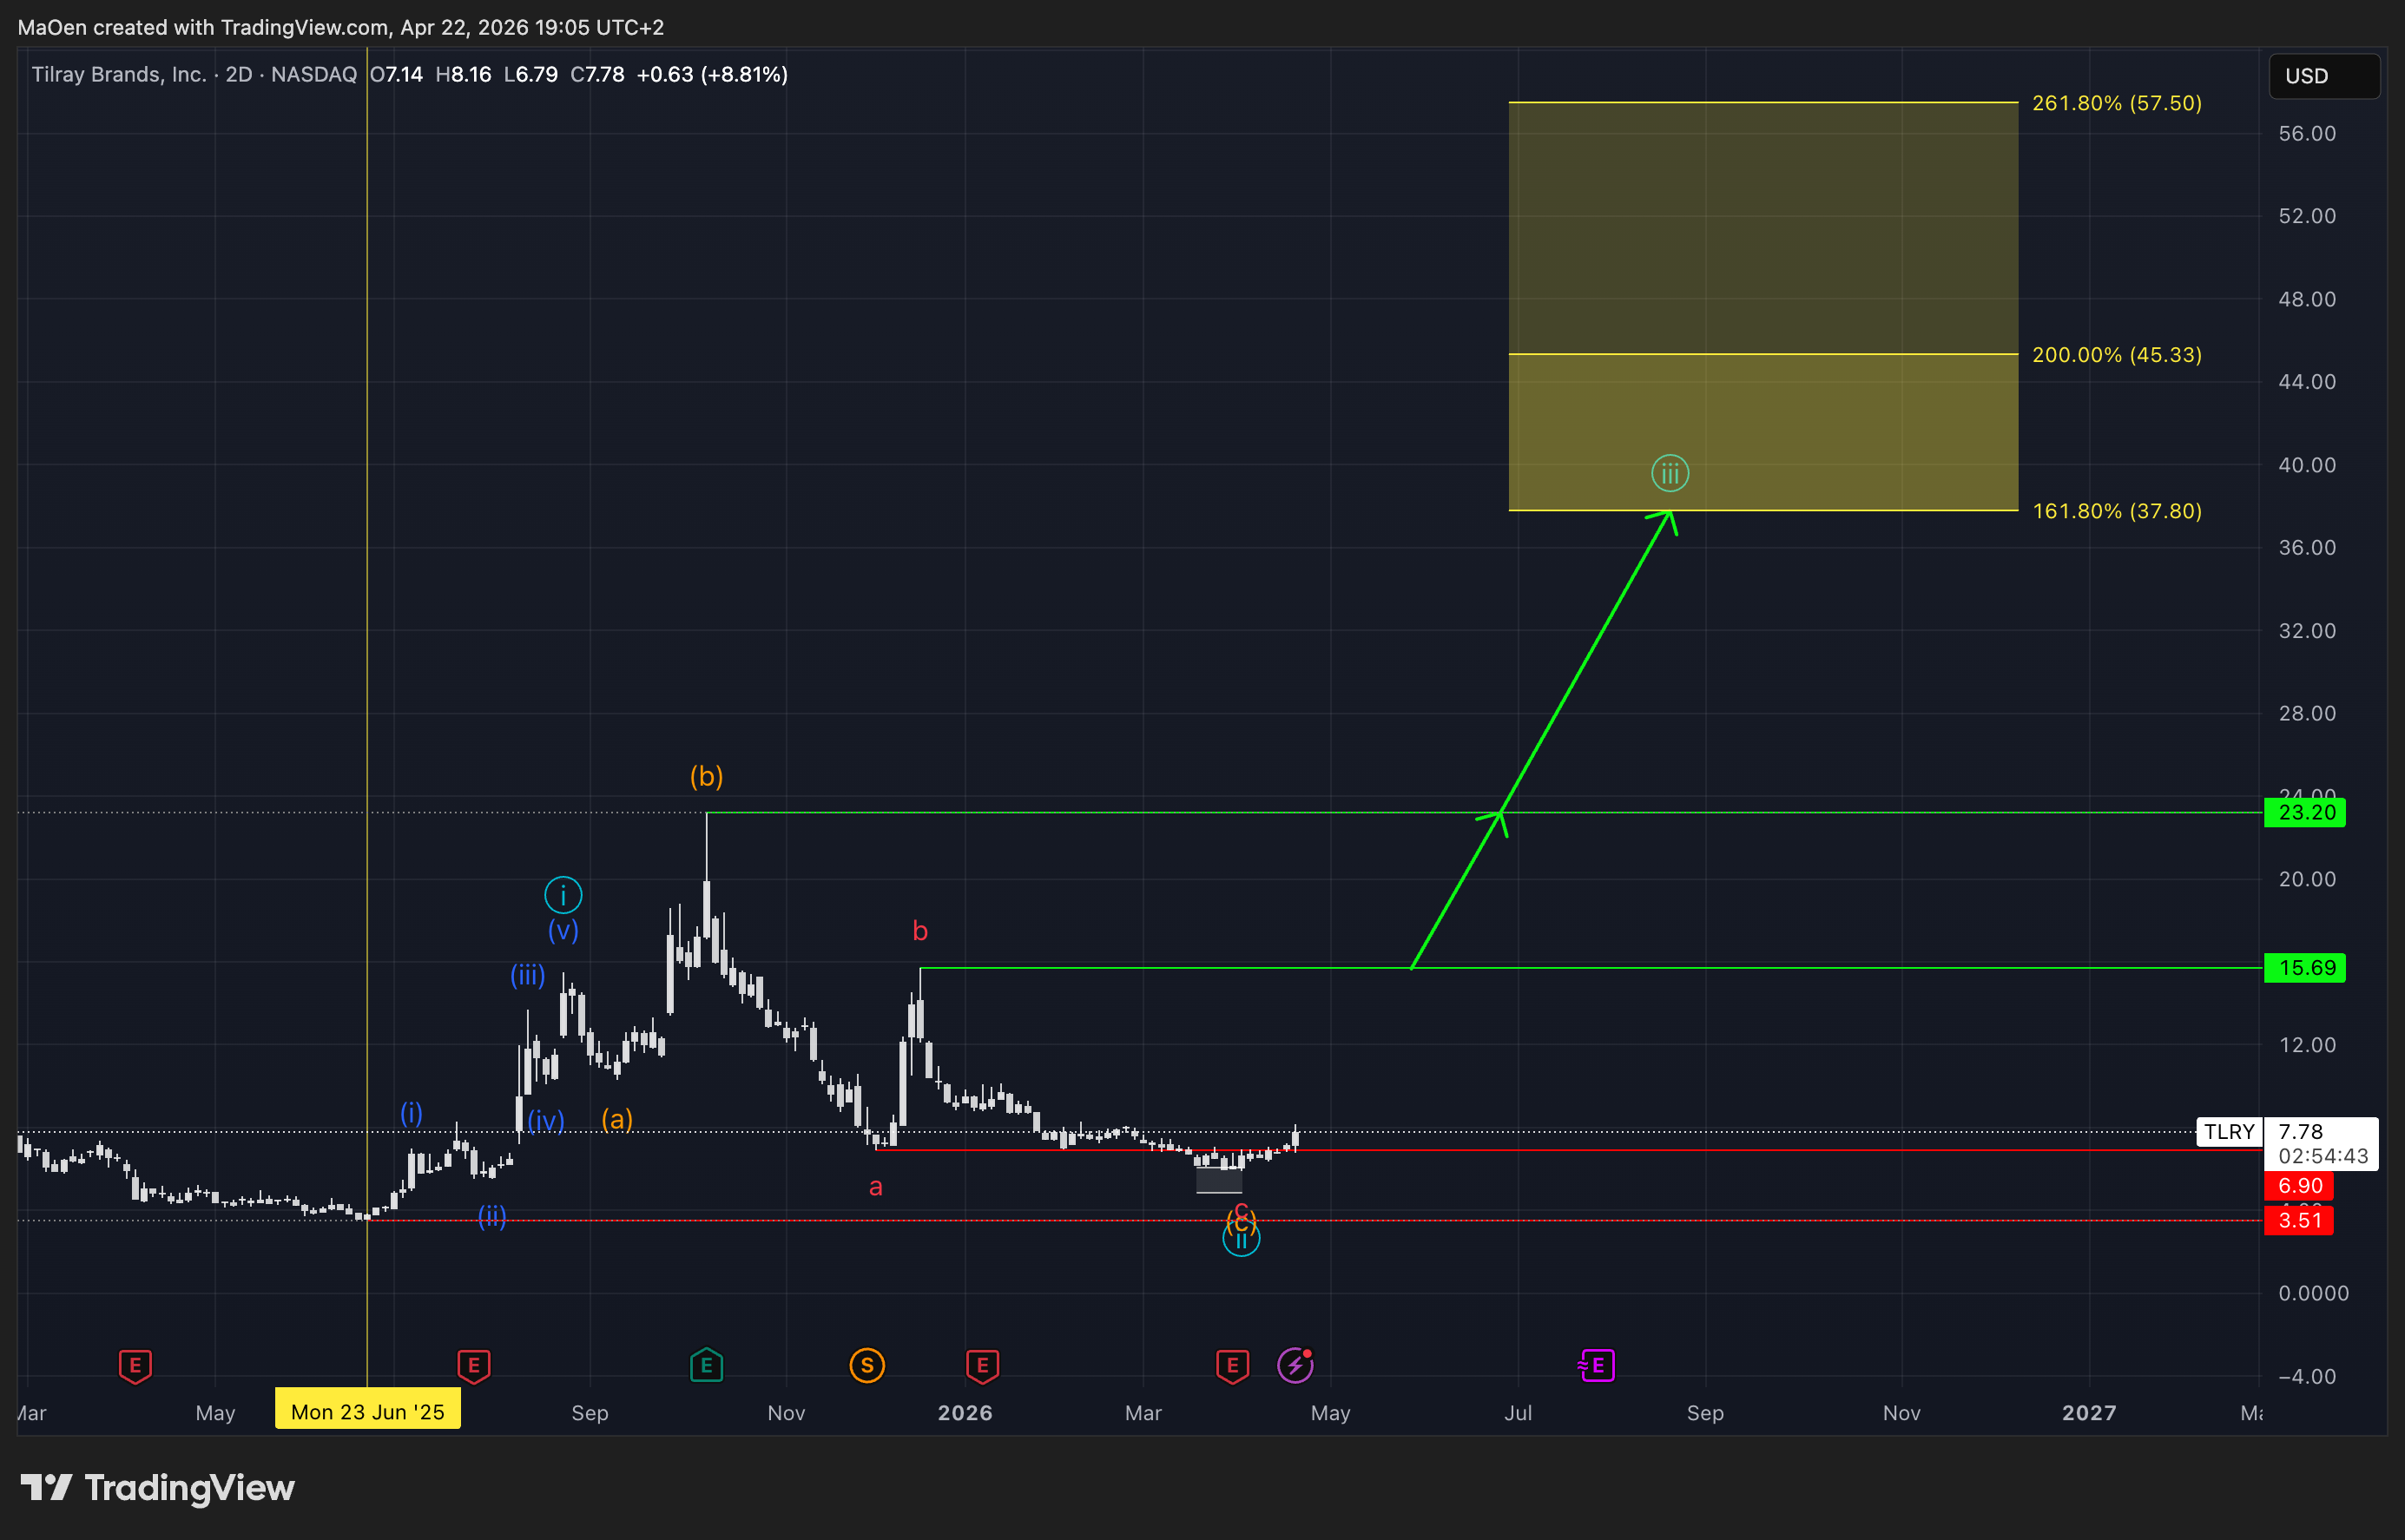
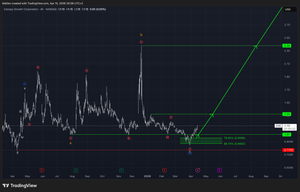
We expect this stock to expand into the long-term light blue wave 3. For this expansionary wave, we have defined Fibonacci-based price targets where we anticipate the stock could move:
- 161.8% at $37.80
- 200% at $45.33
- 261.8% at $57.50
If the stock breaks above the high at $15.69 and the high of orange wave B at $23.20, we strongly expect it to move into this target zone — or potentially extend even higher.
This price target zone reflects our expectations and should be viewed as a guideline for how strong this market could expand. Keep in mind, the market can always fall short of these levels or exceed them significantly.
If any structural changes occur, we will update you immediately.
Kind regards,
Monalytics
DISCLAIMER: The content on this website, including charts, analyses, and recommendations, is for informational purposes only and does not constitute financial, investment, or professional advice. Trading and investing involve risk. You should consult a qualified financial advisor before making any investment decisions.