Tesla has a long market history and has established itself as one of the largest and most influential stocks in the world.
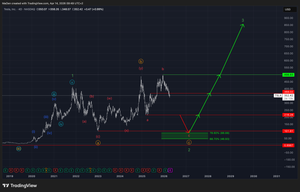
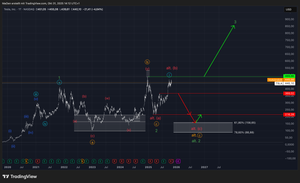
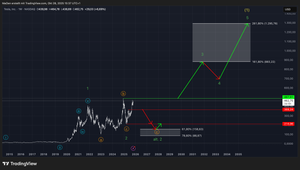
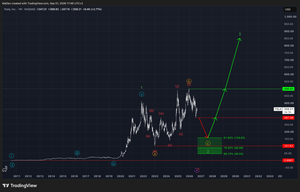
In 2022, Tesla reached a significant high, which we identify as the completion of a major long-term bullish fractal with Green Wave 1. From this high, Tesla entered a substantial long-term corrective phase.
The first leg of this correction, Orange Wave A, was completed at $101.81. From there, Tesla experienced a powerful recovery and eventually reached a new all-time high of $498.83, which we identify as Orange Wave B.
However, despite reaching a new all-time high, we do not consider this move to represent a sustainable long-term bullish fractal capable of continuing the broader Green Wave cycle.
Instead, we expect the long-term correction forming Green Wave 2 to still be ongoing. Based on our current structure, Tesla is now trading within the final leg of this correction, Orange Wave C, which we expect to ultimately complete Green Wave 2.
If our primary scenario plays out, the completion of Green Wave 2 could mark an important long-term turning point and provide the foundation for the next major bullish cycle in Tesla.
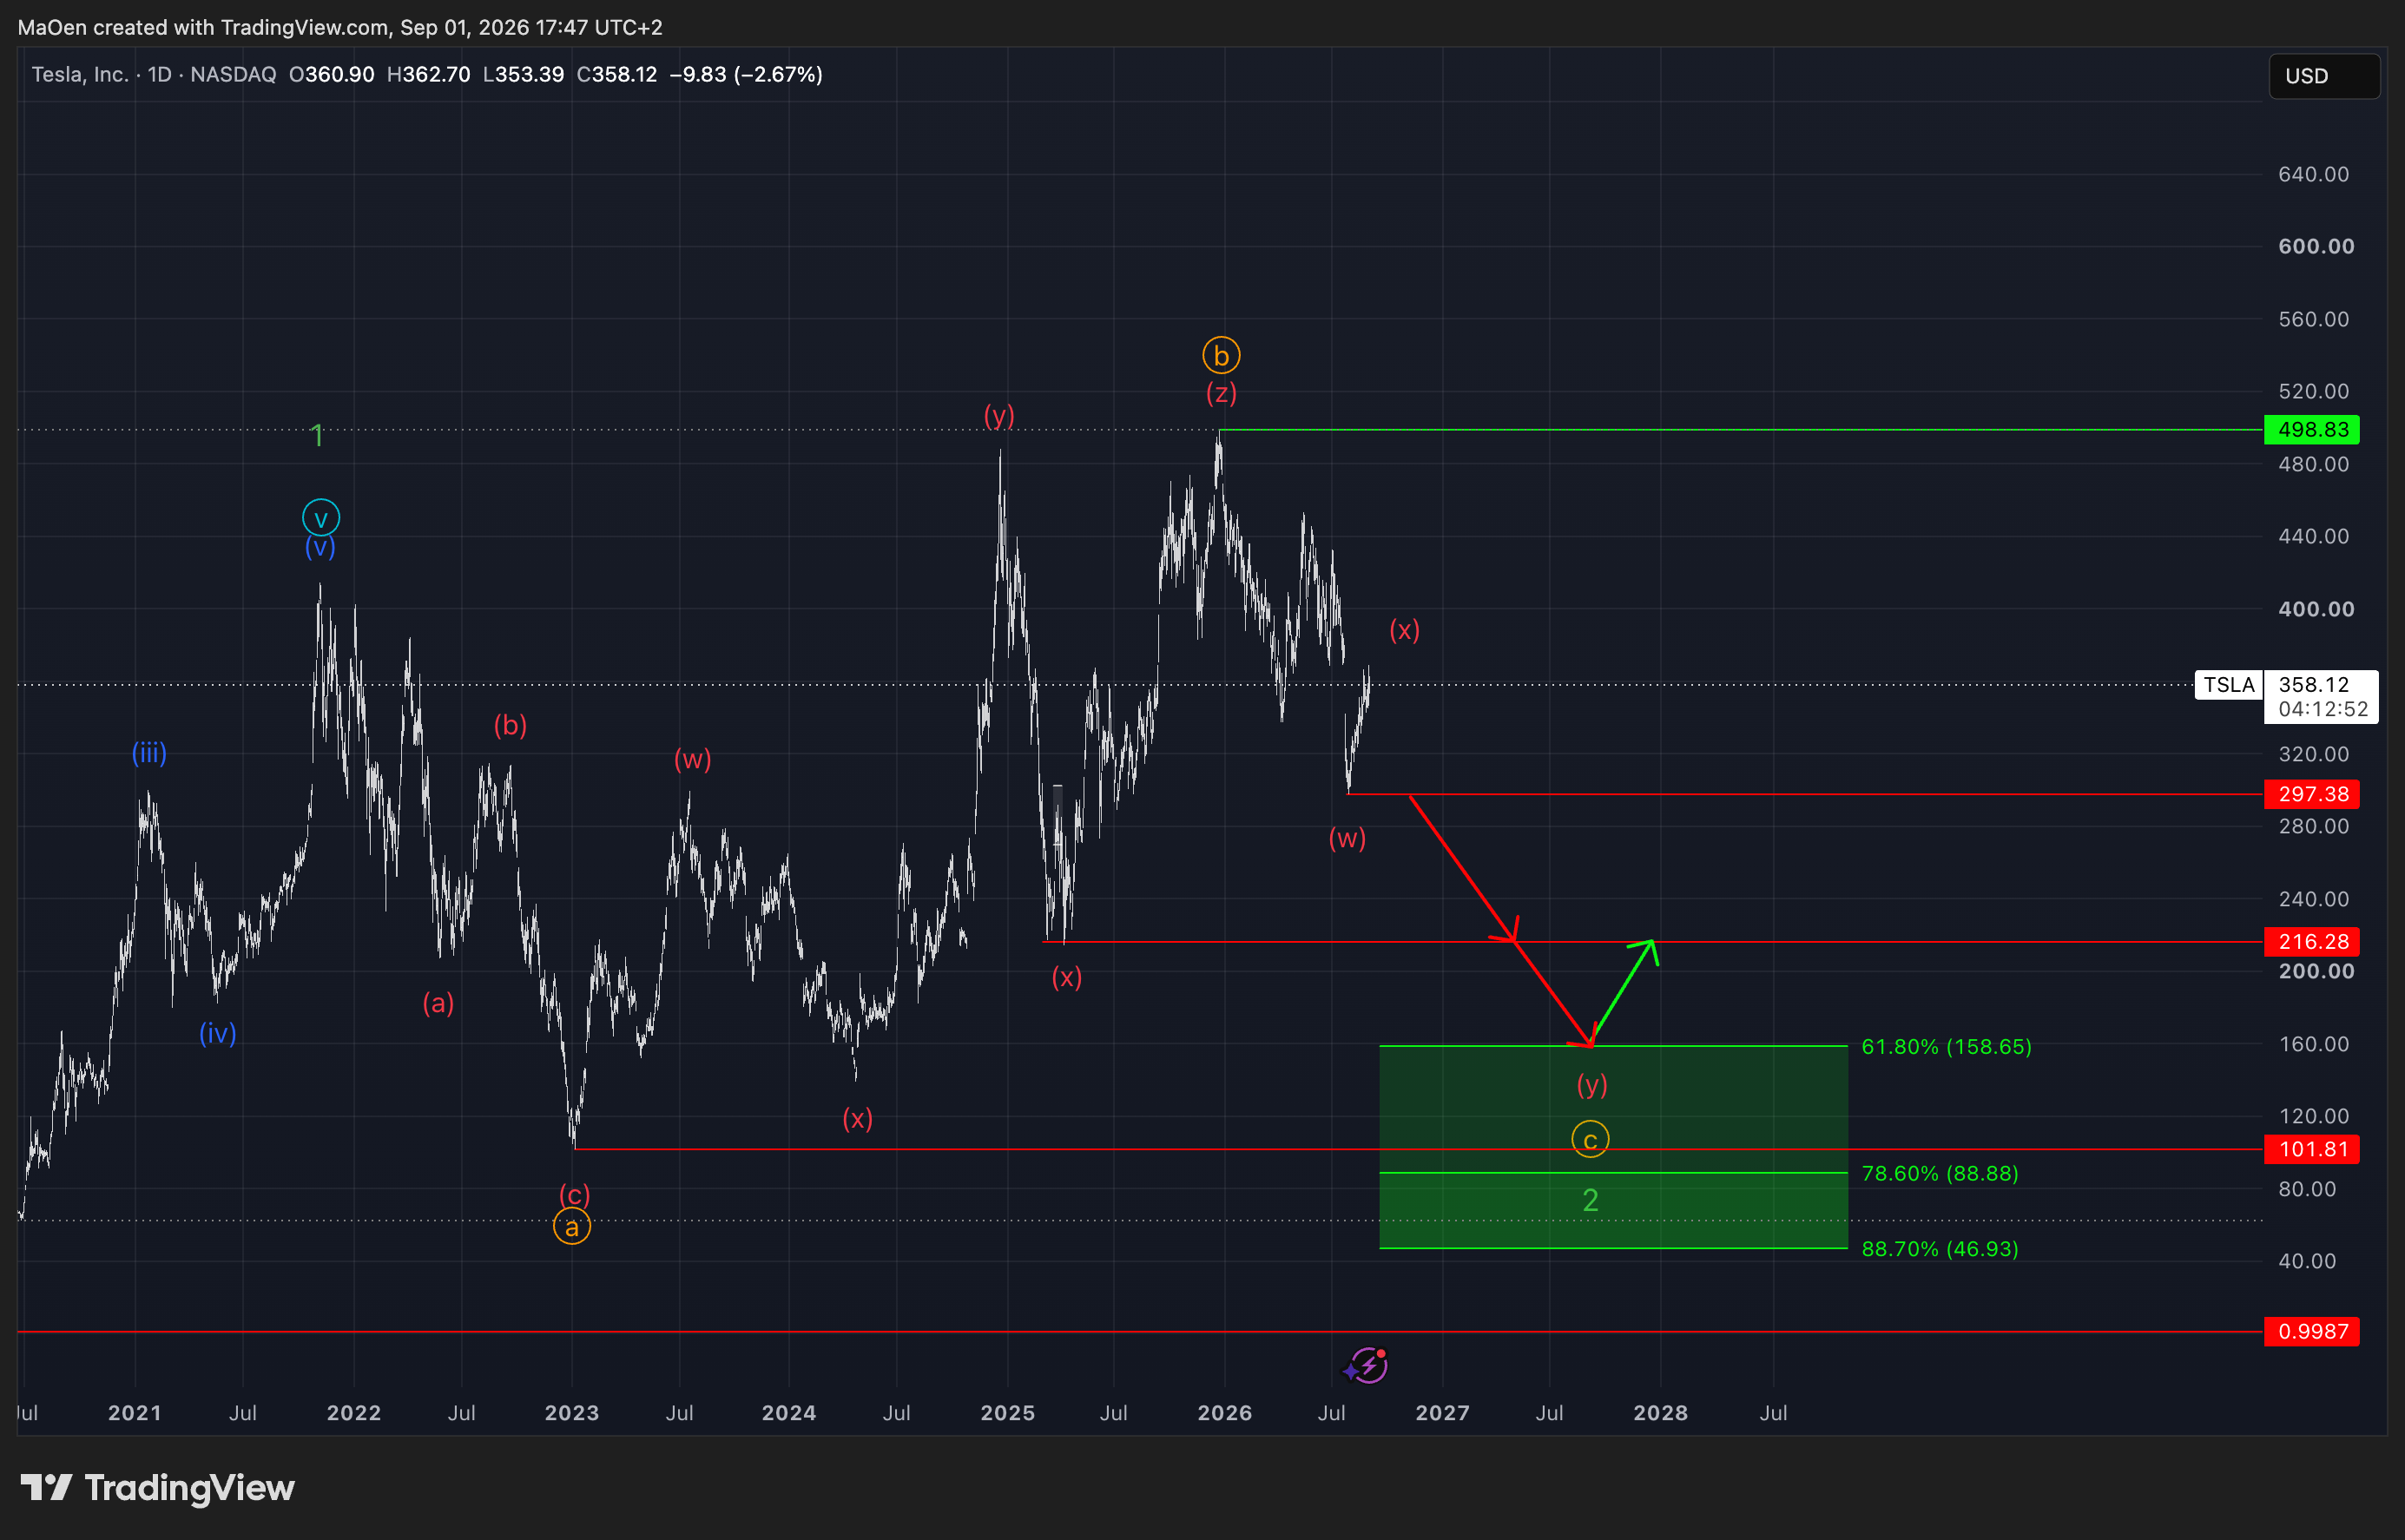
To identify the potential end of this broader correction and the completion of Green Wave 2, we have established a Fibonacci retracement zone where we expect the corrective phase to potentially come to an end.
Long-Term Entry Levels
- 61.8%: $158.65
- 78.6%: $88.88
- 88.7%: $46.93
We consider this Fibonacci zone a major long-term buying opportunity, offering the potential to accumulate Tesla at significantly lower prices.
Before reaching this zone, however, we expect Tesla to experience another major sell-off. A break below $297.38, followed by a break below $216.28, would strengthen our expectation for a continuation of the decline toward our Fibonacci buying zone.
If Tesla reaches this area and our Elliott Wave structure remains intact, we would view the zone as a high-conviction long-term accumulation area ahead of the next potential major bullish cycle.
If anything significant happens with Tesla or our market structure changes, we will update you immediately.
Kind regards,
Monalytics
DISCLAIMER: The content on this website, including charts, analyses, and recommendations, is for informational purposes only and does not constitute financial, investment, or professional advice. Trading and investing involve risk. You should consult a qualified financial advisor before making any investment decisions.