Tesla EW-Analysis
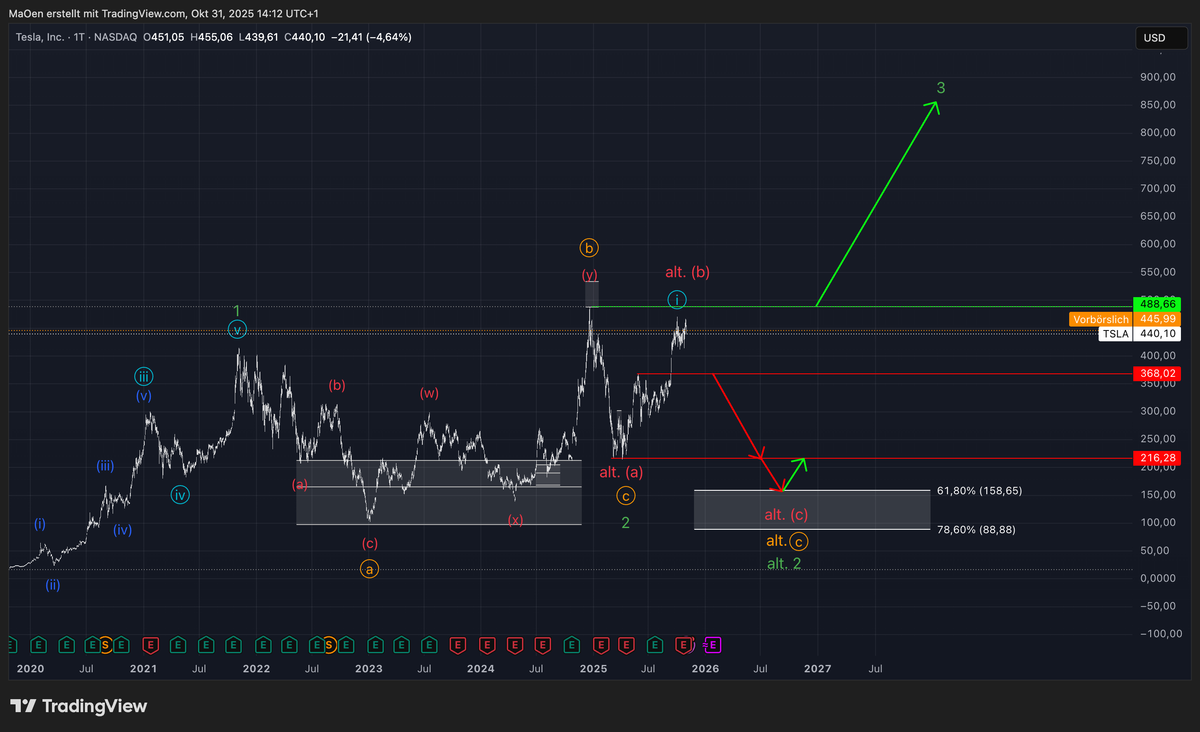
This chart represents Tesla in its Mid-short term Elliot wave analysis, with our primary expectations for this market.
After successfully completing its first impulsive advance as green wave 1, Tesla entered a typical corrective phase forming green wave 2.
As outlined in our long-term analysis, we are currently tracking two primary scenarios. The market will soon confirm which path it intends to follow — we simply need to wait for that decision.
If the corrective phase has already concluded, we expect Tesla to begin building an initial advance as light blue wave 1. Following a smaller retracement into light blue wave 2, a sustained breakout above the all-time high at $488.66(highlighted in neon green) would confirm that Tesla is unfolding a larger impulsive structure toward green wave 3 of a higher degree.
However, if Tesla remains within its corrective structure, we anticipate the market to complete orange wave C, thereby finalizing the corrective green wave 2. This move should ideally terminate within our retracement target zone, ranging from the 61.8% Fibonacci level at $158.65 down to the 78.6% level at $88.88. Within this area, Tesla is expected to complete its correction and begin a new bullish impulsive sequence as green wave 3.
Trading Plan:
At this stage, patience remains key. Once Tesla confirms a clear directional bias, we will validate one of the two scenarios and publish an updated, detailed trading plan.
As long as the current structure remains unchanged, we recommend staying on the sidelines and waiting for further confirmation and Analysis updates before entering new positions.
Keep in mind:
This outlook reflects our primary expectation for Tesla`s Mid to short-term performance. Always ensure that you review our long-term projections first before moving on to our mid- and short-term Elliott Wave analyses.
