SUI - Mid-Short-Term EW-Analysis
This chart represents SUI in its Mid-short term Elliot wave analysis.
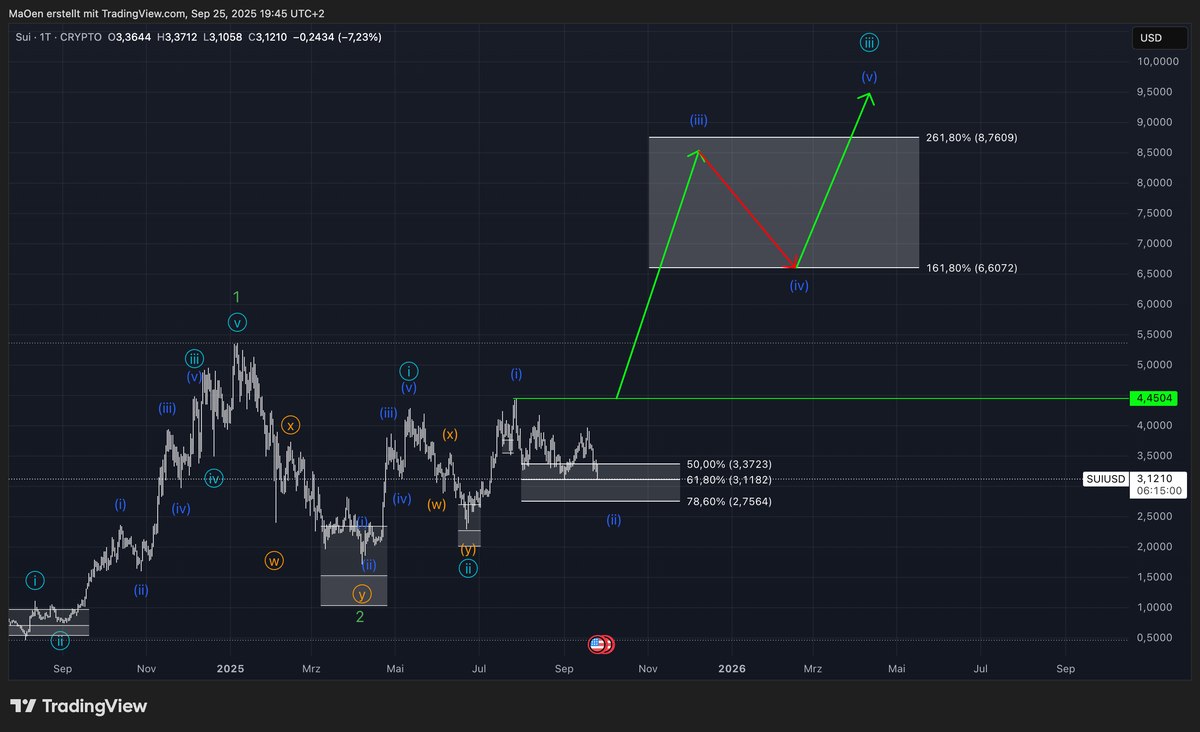
After completing its initial impulse in green Wave 1 followed by the corrective green Wave 2, SUI successfully launched into a new bullish sequence at the light-blue degree, setting the stage for the larger impulsive green Wave 3 in our long-term perspective.
Following the establishment of the light-blue one-two structure, SUI built an additional lower-degree one-two setup in dark blue, which will drive the unfolding of light-blue Wave 3.
For this upcoming light-blue Wave 3, we have projected a Fibonacci price target zone that illustrates our expectations for where the advance could terminate. This zone extends from the 161.8% extension at 6.60 USD up to the 261.8% extension at 8.76 USD.
Trading Plan:
After completing dark-blue Wave 1, we defined a Fibonacci retracement zone where we expect SUI to finalize its corrective dark-blue Wave 2 before resuming its bullish momentum into dark-blue Wave 3.
This retracement zone spans:
· 50% retracement at 3.37 USD
· 61.8% retracement at 3.11 USD
· 78.6% retracement at 2.75 USD
SUI is currently trading within this target zone, which offers highly favorable buy opportunities to align with the continuation of the broader bullish Elliott Wave structure.
Keep in mind:
This outlook reflects our primary expectation for SUI`s Mid to short-term performance. Always ensure that you review our long-term projections first before moving on to our mid- and short-term Elliott Wave analyses.