SUI - Long-Term EW-Analysis
This chart represents our primary long term expectations for SUI.
The cryptocurrency SUI was launched on May 3, 2023, which explains its relatively short chart history.
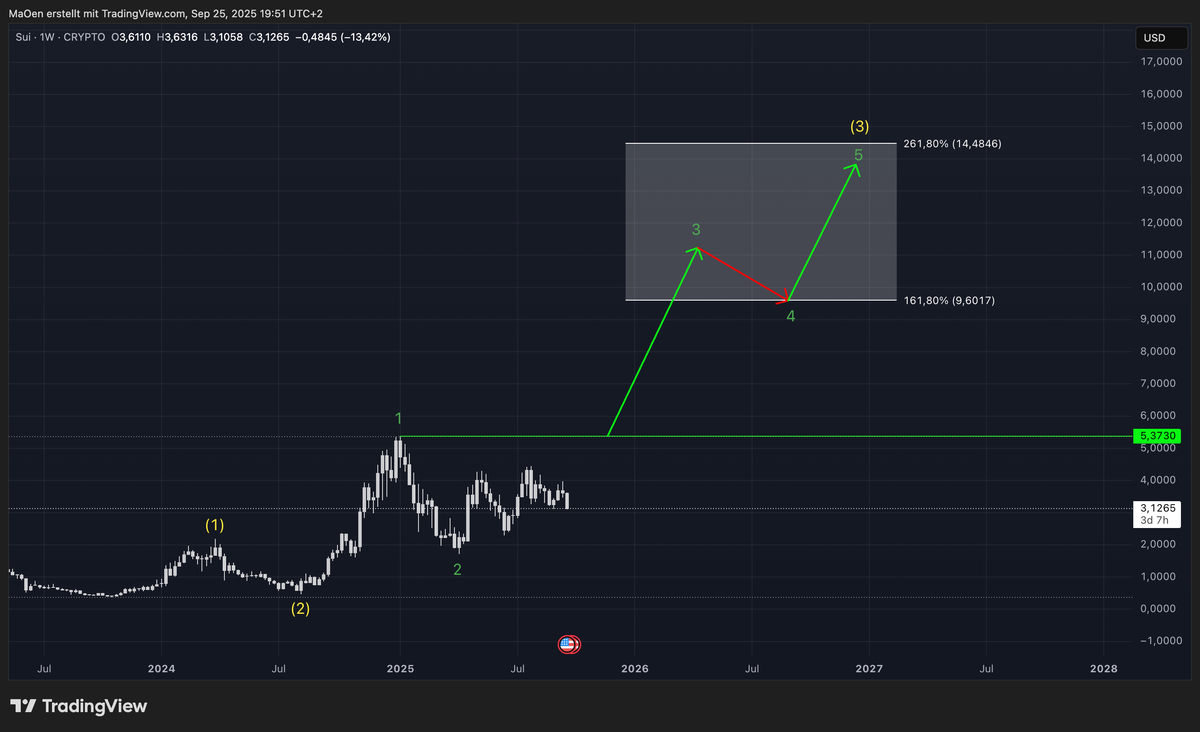
Following its launch, SUI formed a textbook 1-2 setup (marked in yellow), establishing a solid foundation for our Elliott Wave analysis. After completing this initial 1-2 structure, SUI began developing a secondary 1-2 setup on a smaller degree (marked in green). We anticipate that this green cycle will ultimately feed into Wave 3 of the larger yellow degree, targeting our Fibonacci price zone.
Our projected Fibonacci extension targets for Wave 3 (yellow) lie between 161.8% at $9.60 and 261.8% at $14.48.
Trading Plan:
If SUI can break above its recent resistance line at $5.37 (highlighted in neon green), we expect the coin to initiate Wave 3 of the green degree, followed by a Wave 4 corrective structure, and then a final impulsive Wave 5 to complete the green cycle. This sequence will contribute to the overall development of Wave 3 in yellow.
In our mid- to short-term analysis, we will provide a more detailed Analysis on smaller timeframes, highlighting potential buying opportunities for SUI in relation to our long-term analysis.
This outlook reflects our primary expectation for SUI`s long-term performance. Always ensure that you review our long-term projections first before moving on to our mid- and short-term Elliott Wave analyses.