Snowflake (SNOW) EW-Analysis
Snowflake – The Largest Software IPO in History
With its IPO on September 16, 2020, Snowflake made history by delivering the most successful software IPO of all time. After the initial surge, however, the stock entered a prolonged decline and eventually formed a local bottom at $107.13.
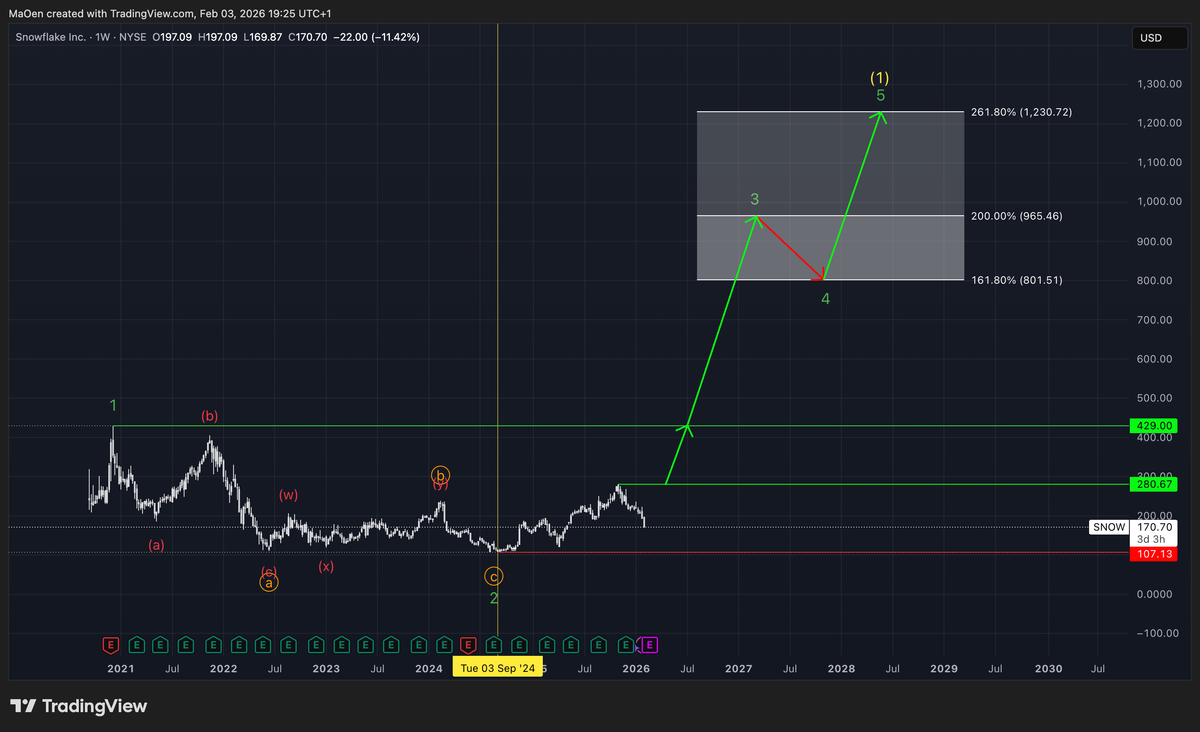
This exceptional IPO allows us to interpret the all-time high at $429 as green wave 1, marking the first fractal of a long-term bullish Elliott Wave cycle. The low at $107.13, reached on September 3, 2024, can be interpreted as the completion of the corrective phase, green wave 2.
From that point onward, Snowflake began developing a new impulsive structure. From a long-term perspective, our primary scenario assumes that the market has already formed a major bottom and has started the next impulsive advance into bullish green wave 3.
That said, a secondary scenario remains possible. In this case, price could still push to new cycle lows before initiating a sustainable impulsive move higher. While this alternative is assigned a lower probability, it cannot be fully ruled out at this stage.
Confirmation of our primary bullish scenario occurs once price breaks and holds above $280.67. Upon such confirmation, we project a Fibonacci extension target zone that serves as a long-term guideline for price development. This target zone includes:
- 161.8% extension: $801.51
- 200% extension: $965.46
- 261.8% extension: $1,230.72
Our long-term primary scenario aligns strongly with the bullish short-term outlook, creating a favorable environment to identify high-quality buying or accumulation opportunities for long-term positioning.
If green wave 2 has indeed completed as anticipated, we expect strong bullish price action over the coming months and years, align with our long-term outlook.
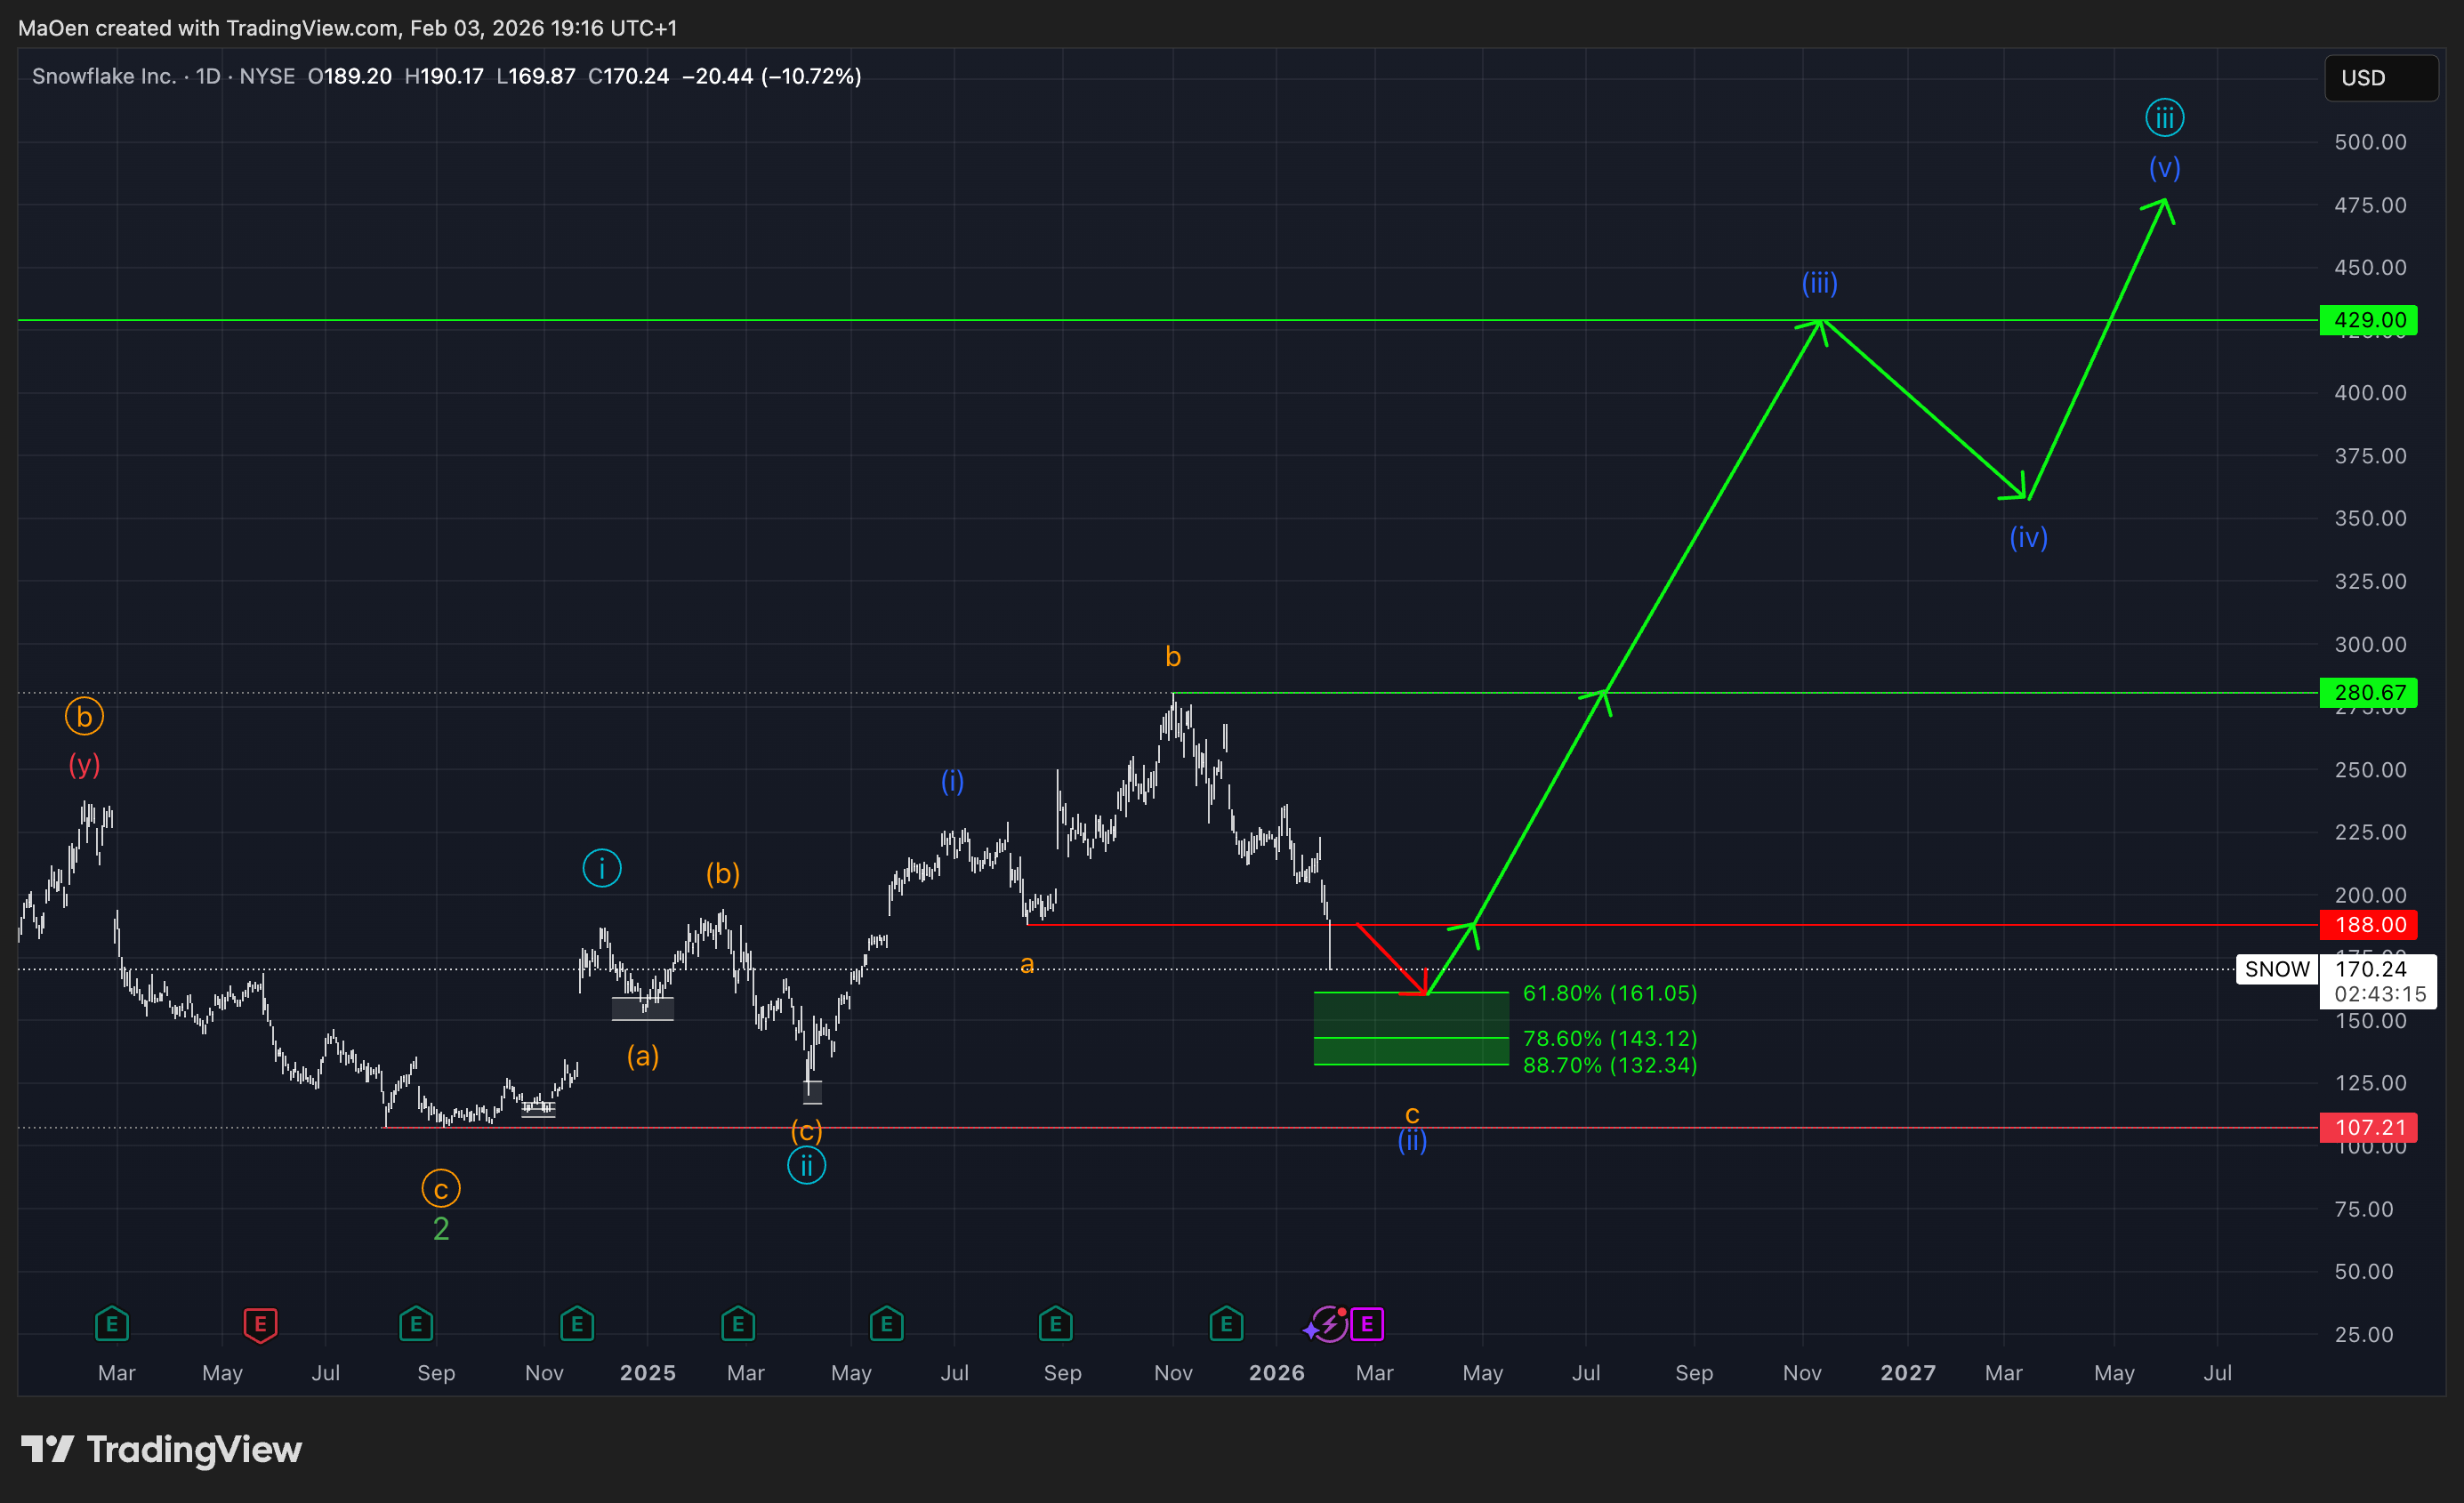
Following the completion of green wave 2, Snowflake successfully developed a light blue 1–2 setup and initiated a new impulsive fractal with dark blue wave 1. At present, this impulsive move is undergoing a correction in the form of dark blue wave 2.
For this corrective wave 2, we have defined a Fibonacci retracement zone in which we expect the correction to terminate and bullish momentum to reassert itself. From this zone, we anticipate the development of dark blue wave 3, followed by a brief corrective wave 4, and a final impulsive wave 5. This sequence would complete light blue wave 3and keep price action aligned with our long-term bullish expectations, ultimately guiding the market toward our long-term target zone.
The Fibonacci retracement zone for dark blue wave 2 is defined as follows:
- 61.8% retracement: $161.05
- 78.6% retracement: $143.12
- 88.7% retracement: $132.34
From our perspective, these levels represent prime buying and accumulation zones, offering optimal positioning for the anticipated long-term bullish cycle.
Should Snowflake reach this Fibonacci retracement zone, or if any relevant structural changes occur, we will provide updates immediately.
Kind regards,
Monalytics
DISCLAIMER: The content on this website, including charts, analyses, and recommendations, is for informational purposes only and does not constitute financial, investment, or professional advice. Trading and investing involve risk. You should consult a qualified financial advisor before making any investment decisions.