Rheinmetall (RHM)
Rheinmetall is currently approaching our defined retracement zone.
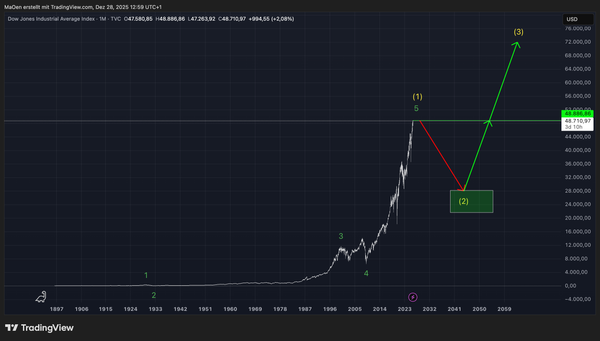
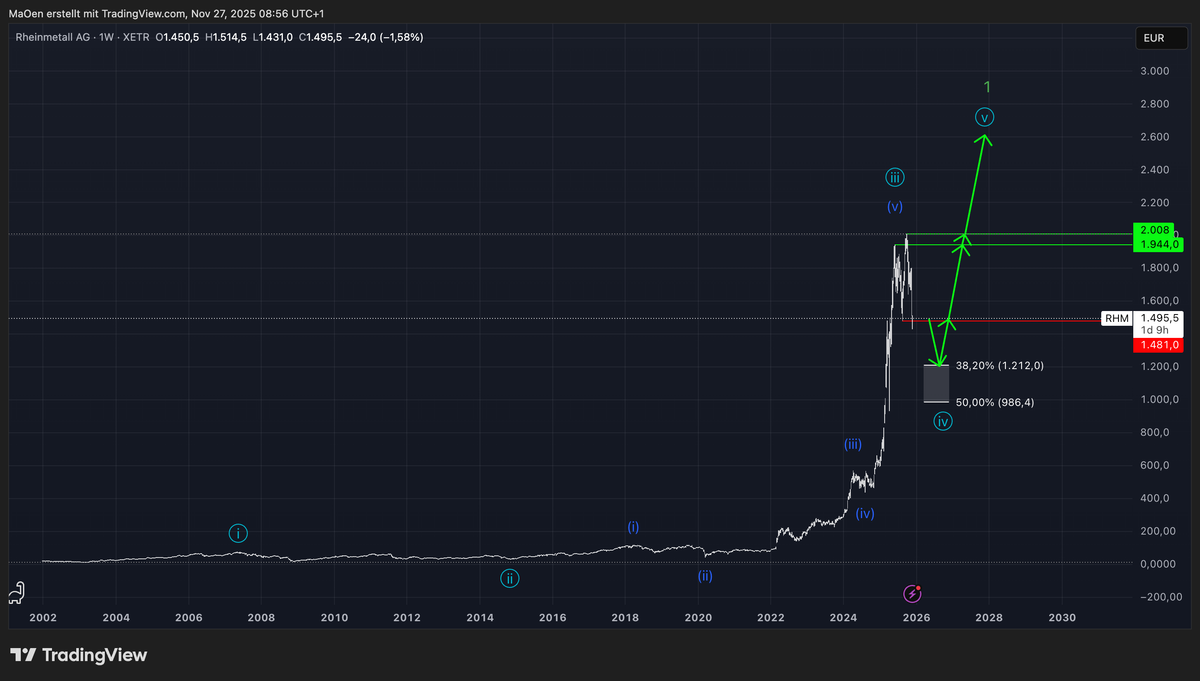
In late 2007, Rheinmetall completed a first full impulse within light blue wave 1, followed by a corrective phase forming light blue wave 2, establishing the structural foundation for the present analysis. After an extended period of consolidation, the stock regained bullish momentum in late 2014 and began its first impulse within the dark blue cycle, which has been unfolding as light blue wave 3.
Most recently, Rheinmetall has printed a new all-time high at 2,008 $, marked in neon green, which we identify as the completion of light blue wave 3. From here, we anticipate the stock to enter a corrective phase, shaping bearish light blue wave 4.
For the development of light blue wave 4, we have defined a Fibonacci retracement zone ranging from the 38.2% level at 1,212.0 $ down to the 50% level at 986.4 $. Within this zone, we expect bearish momentum to gradually shift back to bullish, ultimately terminating light blue wave 4 and initiating new impulsive price action into light blue wave 5. This would complete the entire light blue cycle and establish a major green wave 1 of a higher degree.
This framework represents our long-term outlook for Rheinmetall and aligns closely with our short-term wave count, which provides more granular insight into the key levels the stock must hold or break in order to confirm and validate our broader long-term expectations.
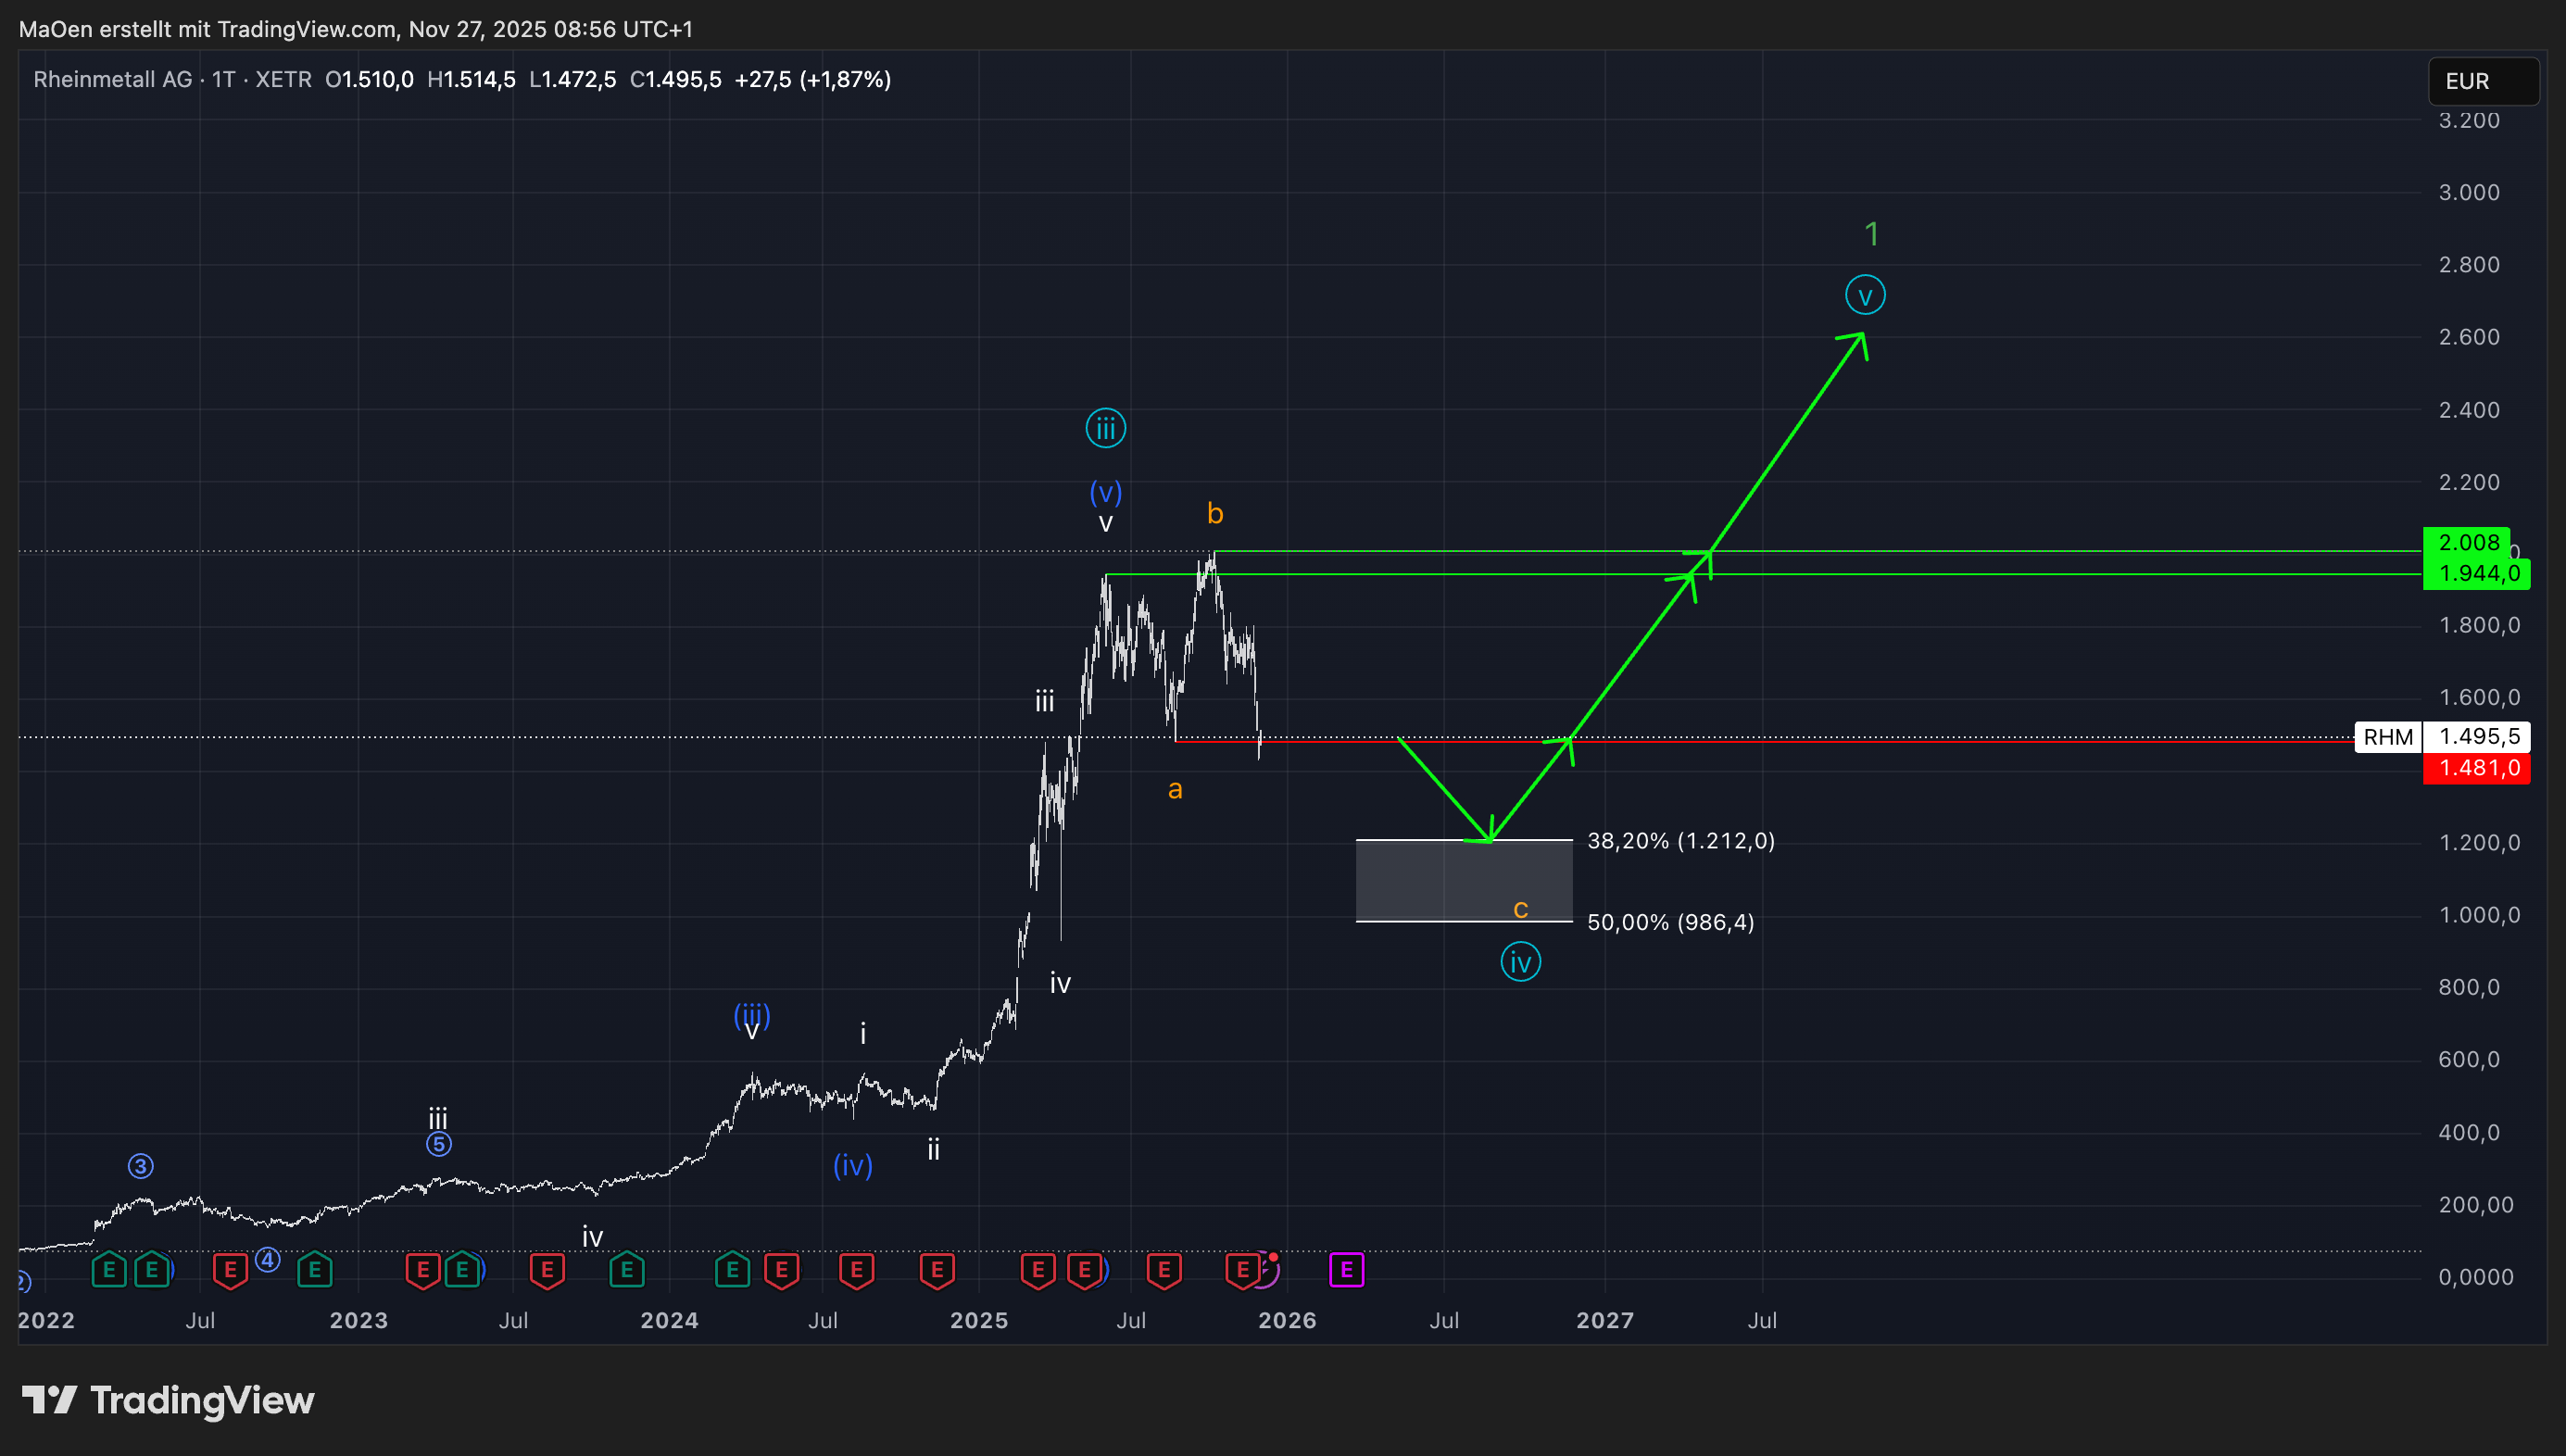
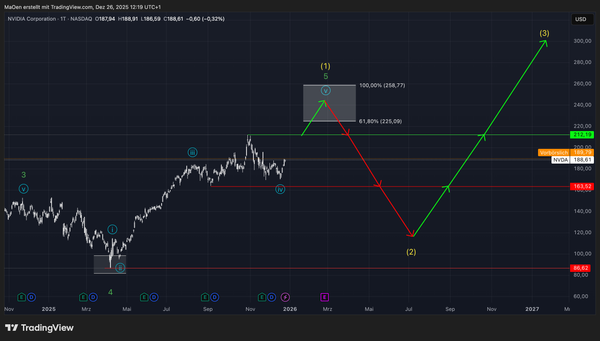
Our short-term count provides a more detailed perspective on the current price action and further supports our broader analysis.
After light blue wave 3 completed at 1,944.0 $, Rheinmetall initiated a first corrective sequence, forming orange wave a. This was followed by an overshooting orange wave b, which set the current all-time high at 2,008 $.
From this extended wave b, the price experienced a sharp sell-off and retraced back to the level of orange wave a, establishing local support at 1,481.0 $.
Trading Plan:
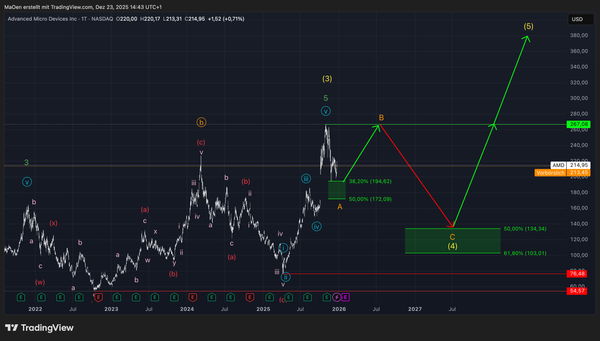
If the price breaks below the low of orange wave a, we hold strong conviction that Rheinmetall will continue to the projected Fibonacci retracement zone, completing orange wave c and finalizing bearish light blue wave 4.
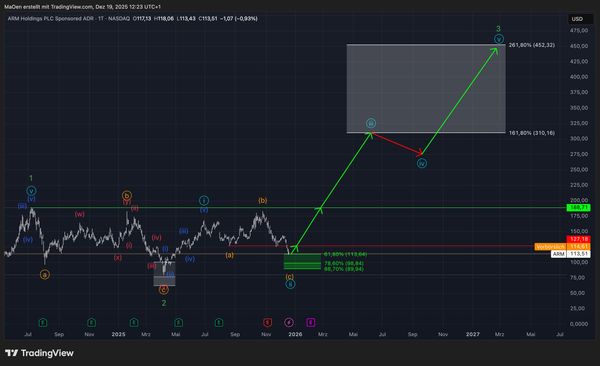
This anticipated retracement zone represents an excellent long-term buying opportunity, as we expect bullish momentum to re-emerge there and initiate a fresh impulsive advance into light blue wave 5.
Overall, we remain bearish until Rheinmetall reaches our retracement zone — at which point our sentiment will shift decisively to bullish.
Once Rheinmetall approaches this zone, or if any structural changes occur in the wave development, we will provide immediate updates.
kind regards,
Monalytics