Render - Long-Term EW-Analysis
This chart represents our primary long term expectations for Render.
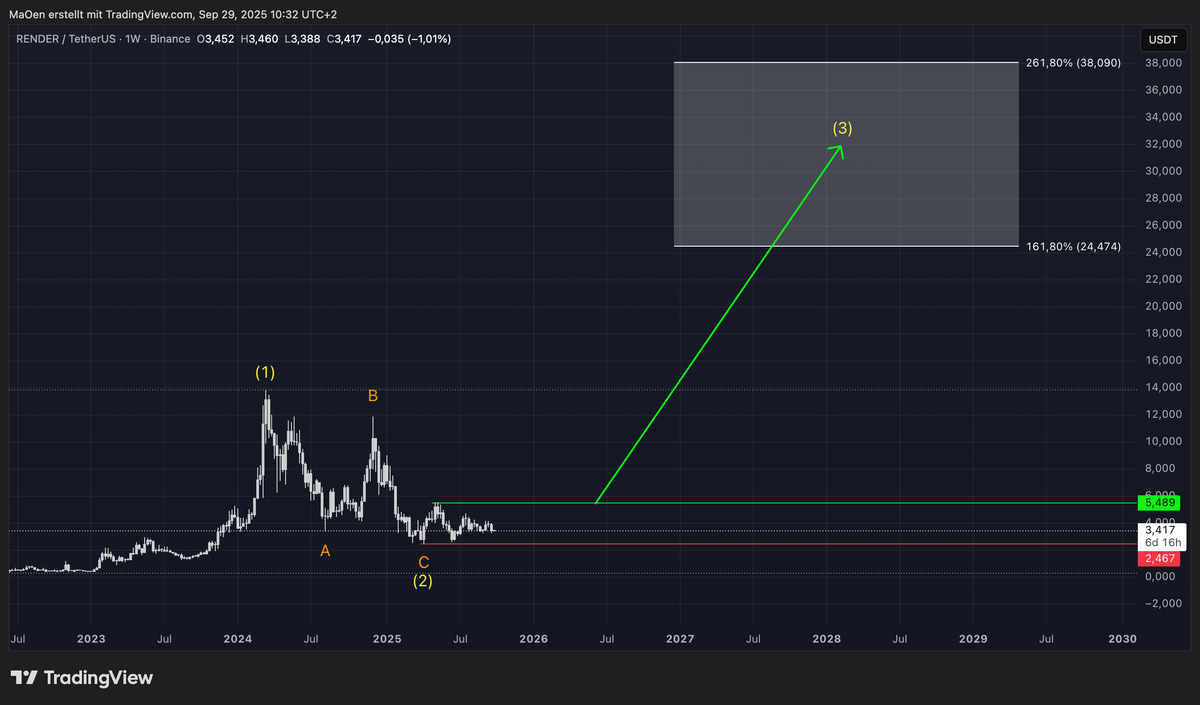
Render has completed a clean 1–2 structure in yellow, starting from early 2023. With Wave 2 corrective action now behind us, we anticipate the market to reverse its current bearish momentum and transition back into a bullish cycle, unfolding into Wave 3 in yellow.
For this upcoming Wave 3, we defined a Fibonacci extension target zone, which marks our primary price expectations for the impulsive advance:
- 161.8% extension at 24.47 USD
- 261.8% extension at 38.09 USD
These levels highlight the potential range where we expect Wave 3 in yellow to complete.
Trading Plan:
If Render manages to break above its local resistance at 5.48 USD, this would serve as confirmation of renewed bullish momentum and a strong indication that Wave 3 in yellow is underway. At that point, the coin would likely enter an extended impulsive advance toward our projected Fibonacci target zone.
In our mid- to short-term analysis, we will provide a more detailed Analysis on smaller timeframes, highlighting potential buying opportunities for Render in relation to our long-term analysis.
This outlook reflects our primary expectation for Render`s long-term performance. Always ensure that you review our long-term projections first before moving on to our mid- and short-term Elliott Wave analyses.