Polkadot - Long-term EW-Analysis
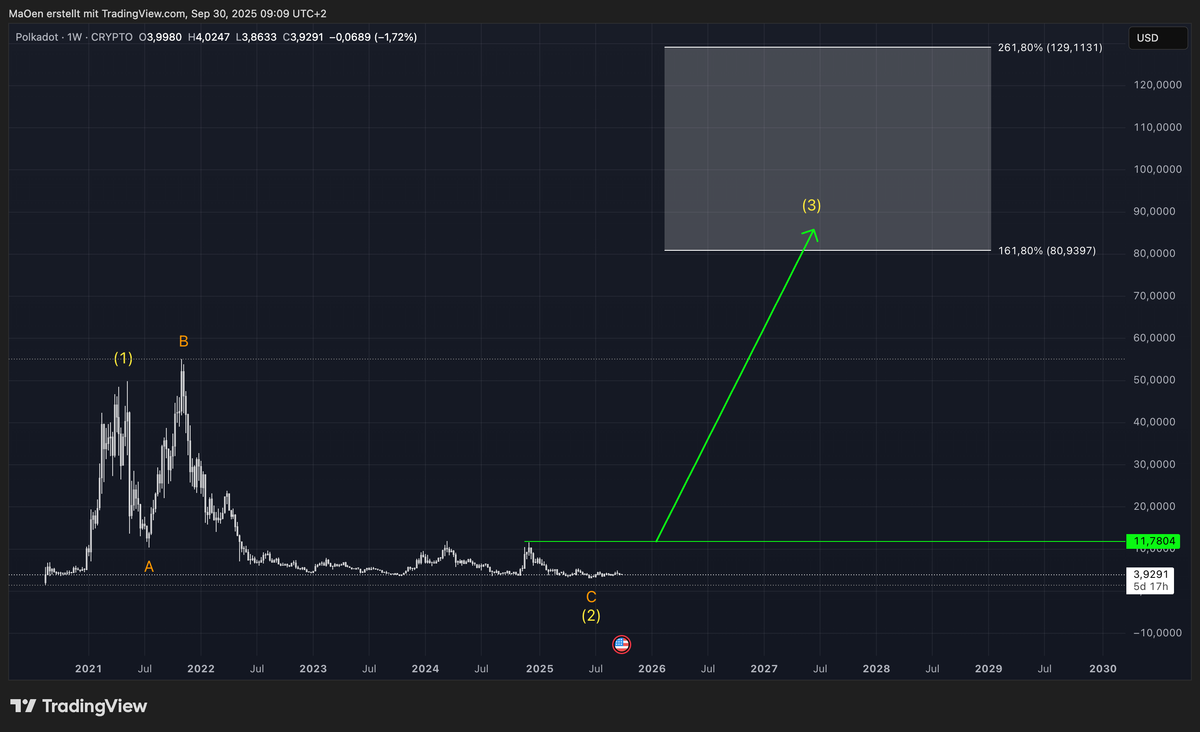
This chart represents our primary long term expectations for Polkadot.
Polkadot has already completed a clean one-two structure in yellow in the past. Unlike many other cryptocurrencies, Polkadot extended into new cycle lows to finalize its corrective yellow Wave 2.
A decisive break above the neon-green resistance at 11.78 USD would strongly confirm that Polkadot has finally transitioned into a new bullish momentum cycle, unfolding into yellow Wave 3, but be patient, it miht take a while.
Unless, for this upcoming Wave 3, we have defined a Fibonacci extension target zone, where we expect the advance to potentially terminate:
- 161.8% extension at 80.93 USD
- 261.8% extension at 129.11 USD
Trading Plan:
Patience remains essential until Polkadot firmly breaks above the 11.78 USD resistance level. Once confirmed, this would validate the onset of yellow Wave 3. In addition, our mid- to short-term analysis provides more detailed calculations for the termination of yellow Wave 2 and identifies the emergence of new impulsive structures.
In our mid- to short-term analysis, we will provide a more detailed Analysis on smaller timeframes, highlighting potential buying opportunities for Polkadot in relation to our long-term analysis.
This outlook reflects our primary expectation for Polkadot`s long-term performance. Always ensure that you review our long-term projections first before moving on to our mid- and short-term Elliott Wave analyses.