Novo Nordisk (NVO) EW-Analysis
A Big Cycle Correction
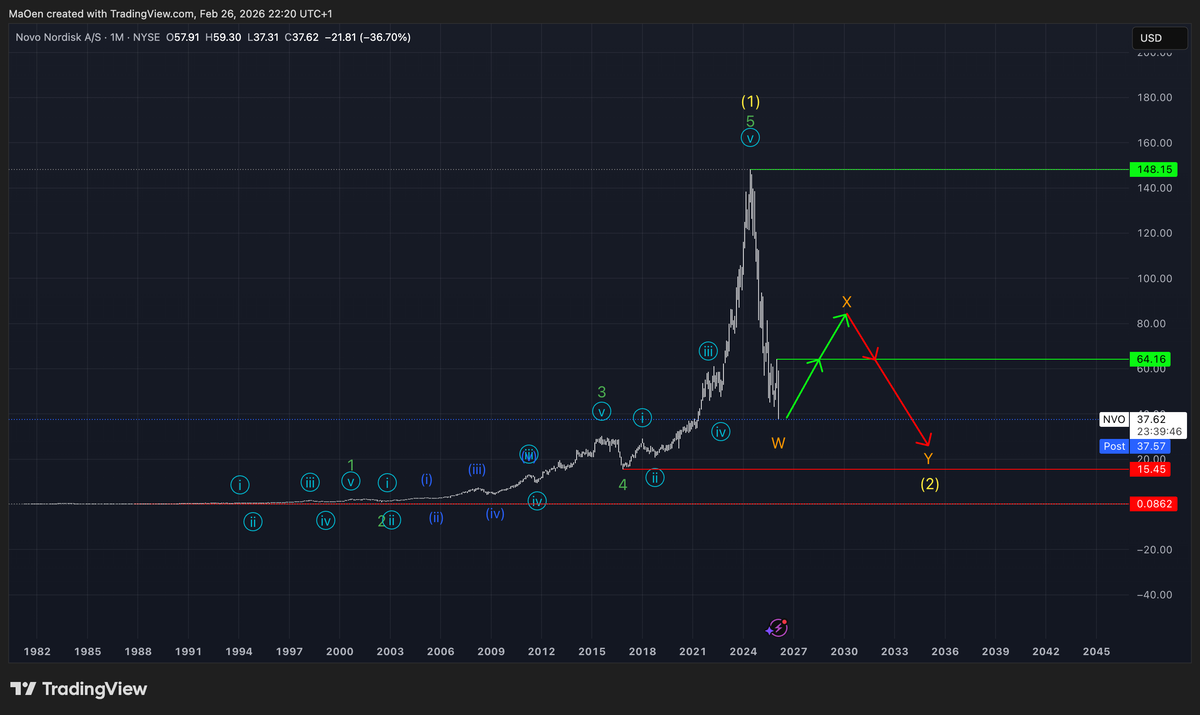
Since its IPO in 1981, Novo Nordisk has followed a massive bull run. After forming green wave 1 in 2001 and the corrective green wave 2 in 2003, the stock established the foundation for a long-term uptrend.
By developing green waves 3 and 4, the long-term bull run entered its final impulsive upward movement, forming bullish green wave 5. Once green wave 5 was completed in 2024, Novo Nordisk formed yellow wave 1 and marked a major top at its all-time high of $148.15.
From that point onward, the stock experienced a brutal sell-off, initiating an additional over-cyclical correction into long-term bearish yellow wave 2.
However, we expect this sell-off to be only the beginning of a larger corrective structure. There is no reason to panic. We anticipate that the current decline is forming orange wave W. Once this wave is completed, we expect to see a bullish recovery in the stock.
However, we believe this recovery will not be sustainable. This upward movement would form orange wave X. After its completion, we anticipate another significant sell-off into orange wave C, which would complete the entire corrective phase and terminate yellow wave 2.
It is important to understand that this corrective phase originates from a large cycle degree. This means the correction could extend over several years. Nevertheless, there may still be opportunities to generate profits within this market.
We have defined a Fibonacci retracement zone in which we expect orange wave W to find its termination and from which we anticipate a bullish recovery to begin.
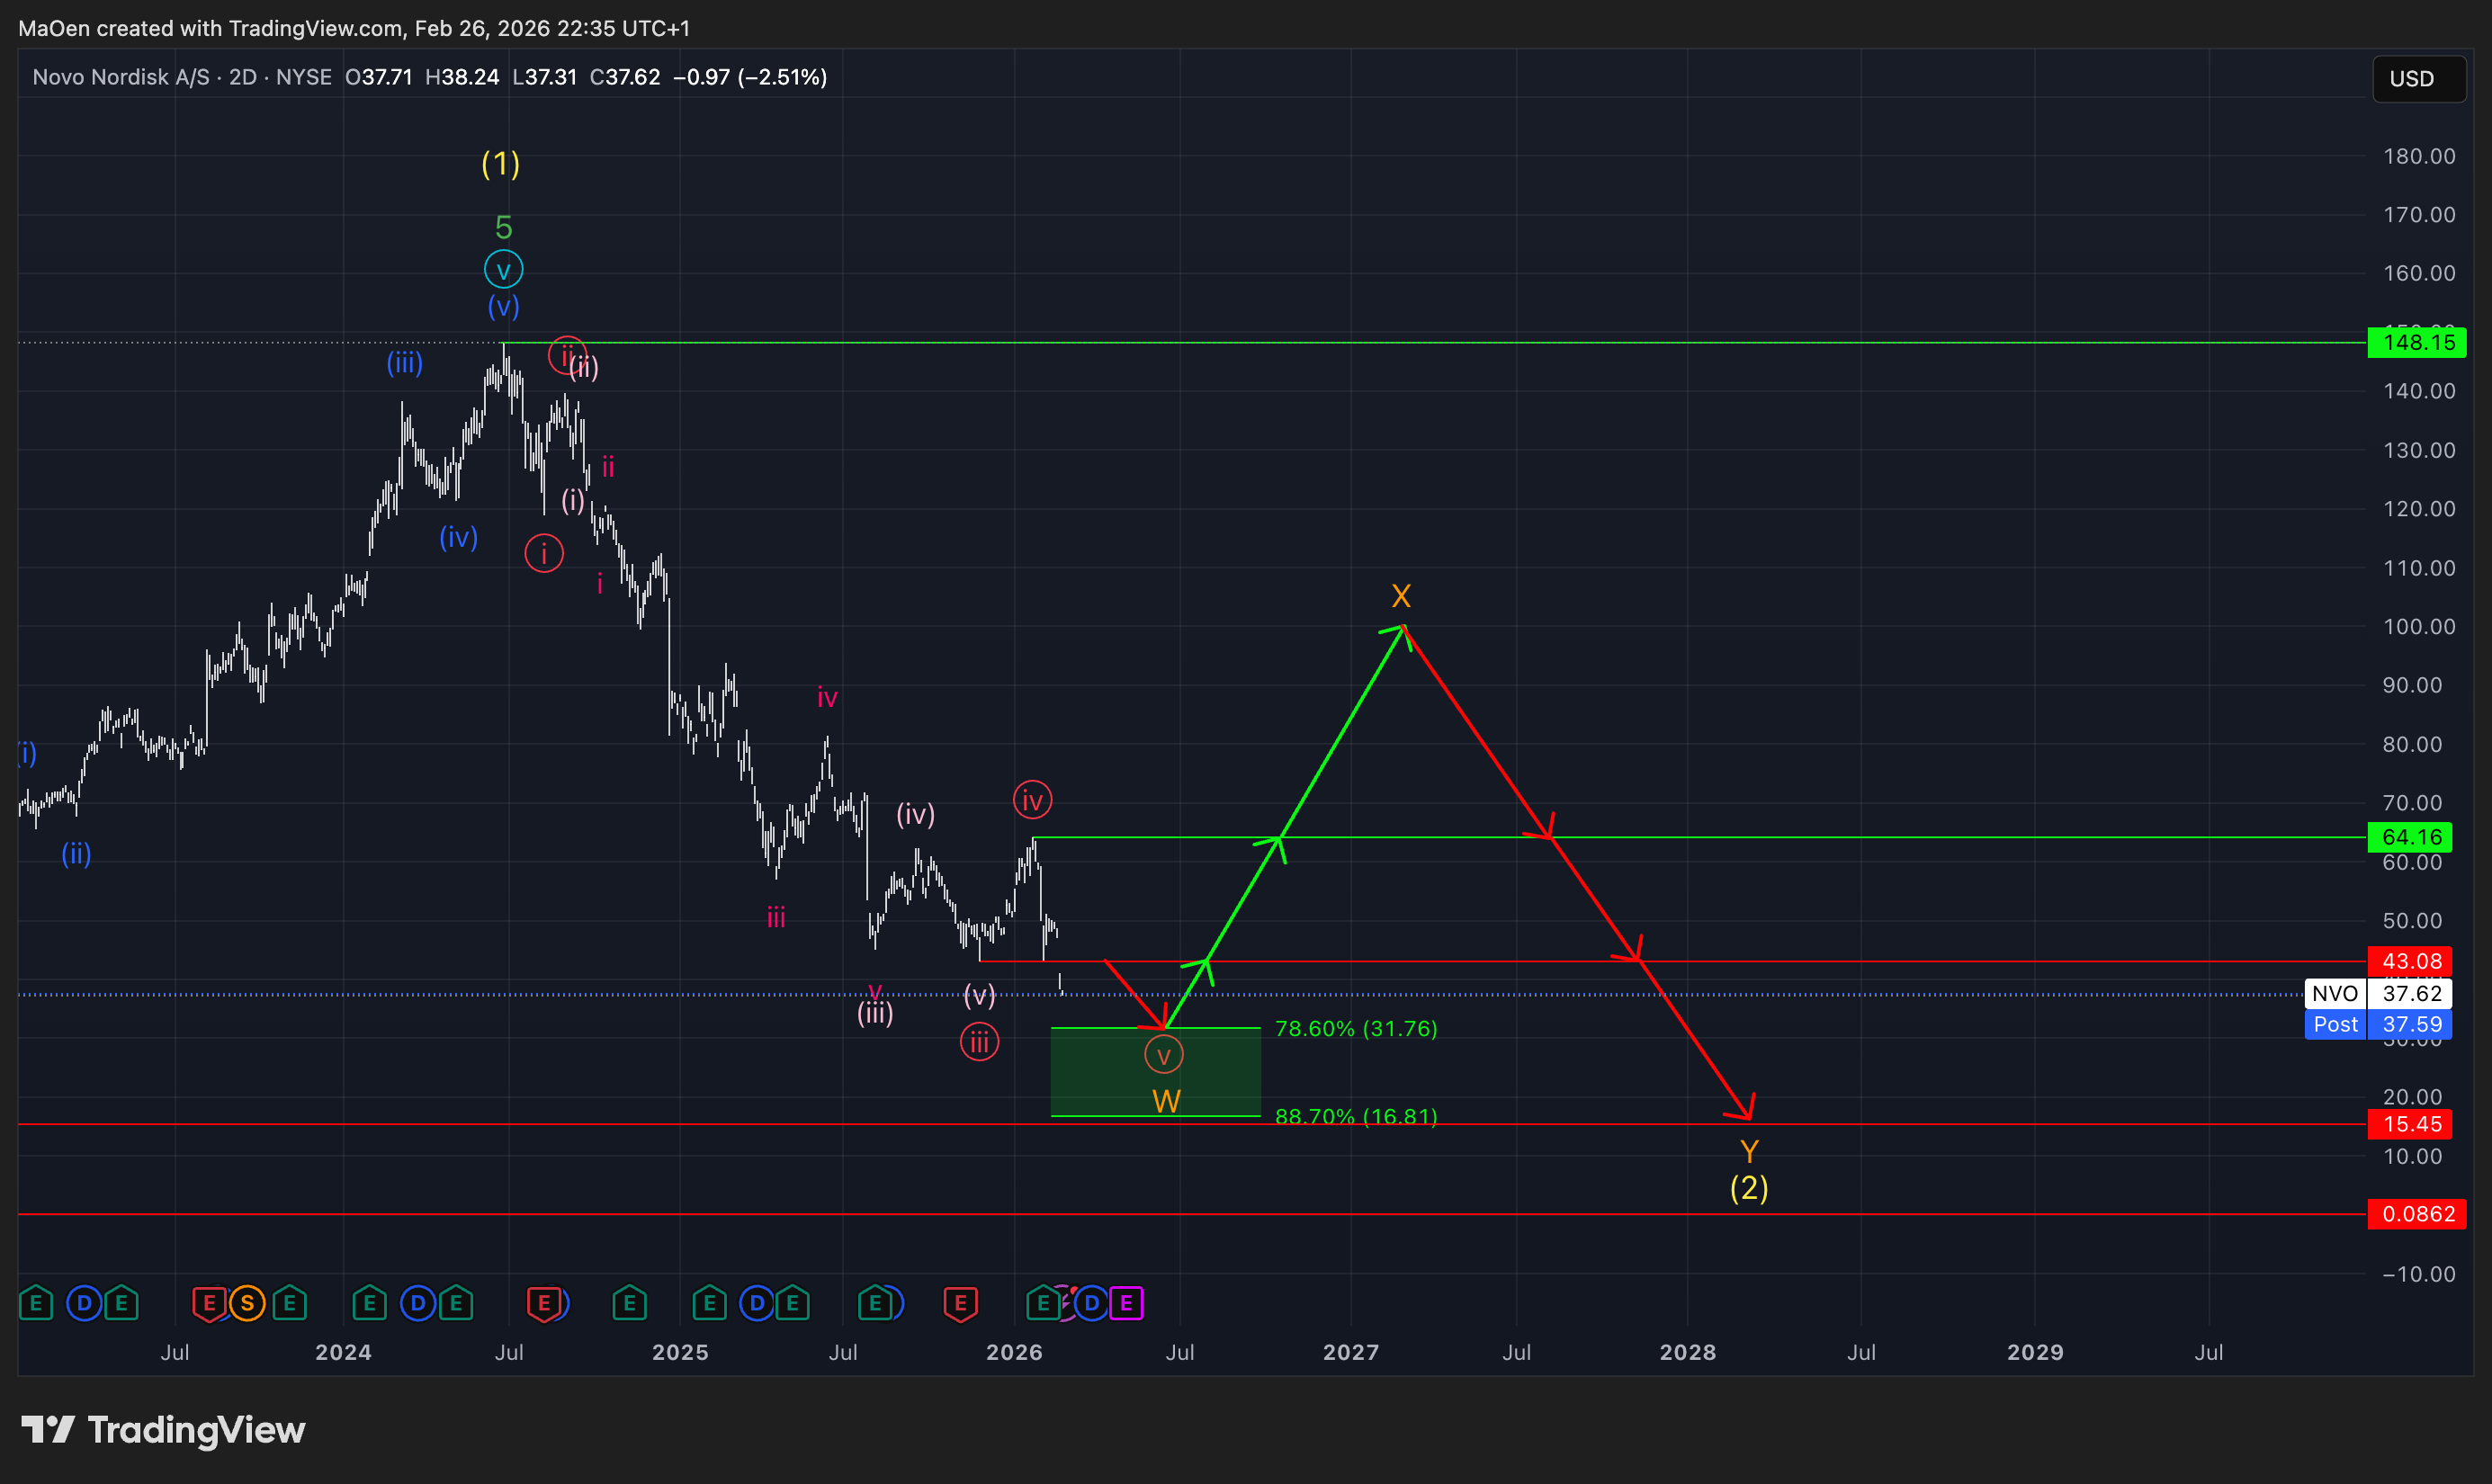
Our Fibonacci retracement zone ranges between:
- 78.6% retracement at $31.76
- 88.7% retracement at $16.81
If the market enters and activates this zone, we expect bullish momentum to return and bring the current brutal sell-off to an end. This zone represents a significant opportunity to buy or accumulate the stock for a short-term position, based on our analysis that the market could enter a bullish recovery to the upside.
In addition, this zone may allow investors who are already positioned in the stock and are currently under water to place additional buy orders using a DCA (Dollar Cost Average) strategy in order to manage and optimize their position.
As soon as the market activates our Fibonacci retracement zone and regains strong bullish momentum to the upside, we will provide a new Fibonacci zone to define potential sell targets for the upcoming long positions or to identify a shorting opportunity.
If any structural changes occur or Novo Nordisk activates our defined Fibonacci retracement zone, we will update you immediately.
Kind regards,
Monalytics
DISCLAIMER: The content on this website, including charts, analyses, and recommendations, is for informational purposes only and does not constitute financial, investment, or professional advice. Trading and investing involve risk. You should consult a qualified financial advisor before making any investment decisions.