Nasdaq (NDX)
Nasdaq at its top.
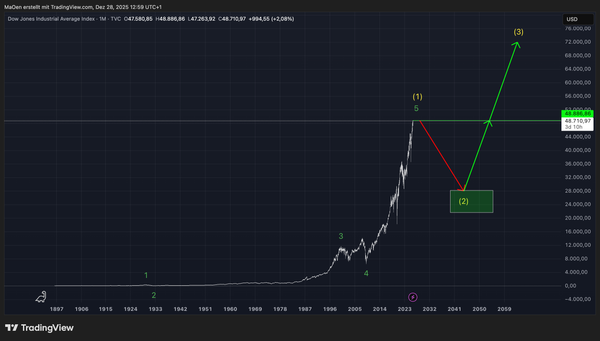
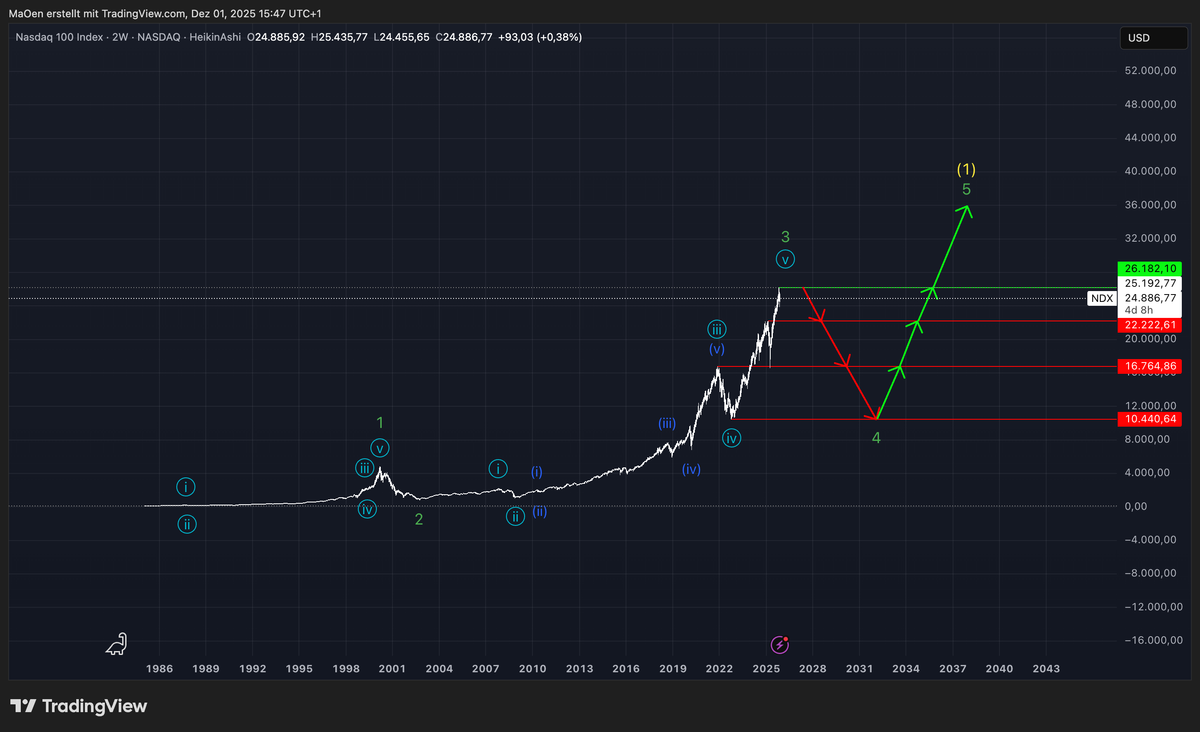
Since January 1985, the Nasdaq has shown a strong and highly impulsive performance, forming—with the completion of the light-blue cycle—the first sequence of the larger green cycle. After completing green wave 1 and the subsequent green wave 2 into the 2002 low, the index entered a major bullish phase that has driven it steadily into green wave 3. This green cycle represents our overarching long-term Elliott-Wave count for the Nasdaq.
At present, green wave 3 is approaching its final stage. Once this wave concludes, we expect the index to transition into a bearish green wave 4, marking a significant long-term correction phase. Following its completion, the Nasdaq should be positioned to regain bullish momentum and advance into green wave 5, which would complete the entire impulsive sequence of the green cycle. This, in turn, finalizes yellow wave 1 of the major long-term yellow cycle.
Upon confirmation of the completion of green wave 3, we will provide a dedicated Fibonacci retracement zone in which we expect the Nasdaq to complete its upcoming corrective phase into green wave 4 before resuming long-term bullish acceleration into the final impulsive wave of the green cycle.
In our short-term analysis, we deliver a more detailed breakdown of the current short-term wave count and outline the zones in which we expect the Nasdaq to potentially top out and initiate the long-term correction into the anticipated bearish green wave 4.
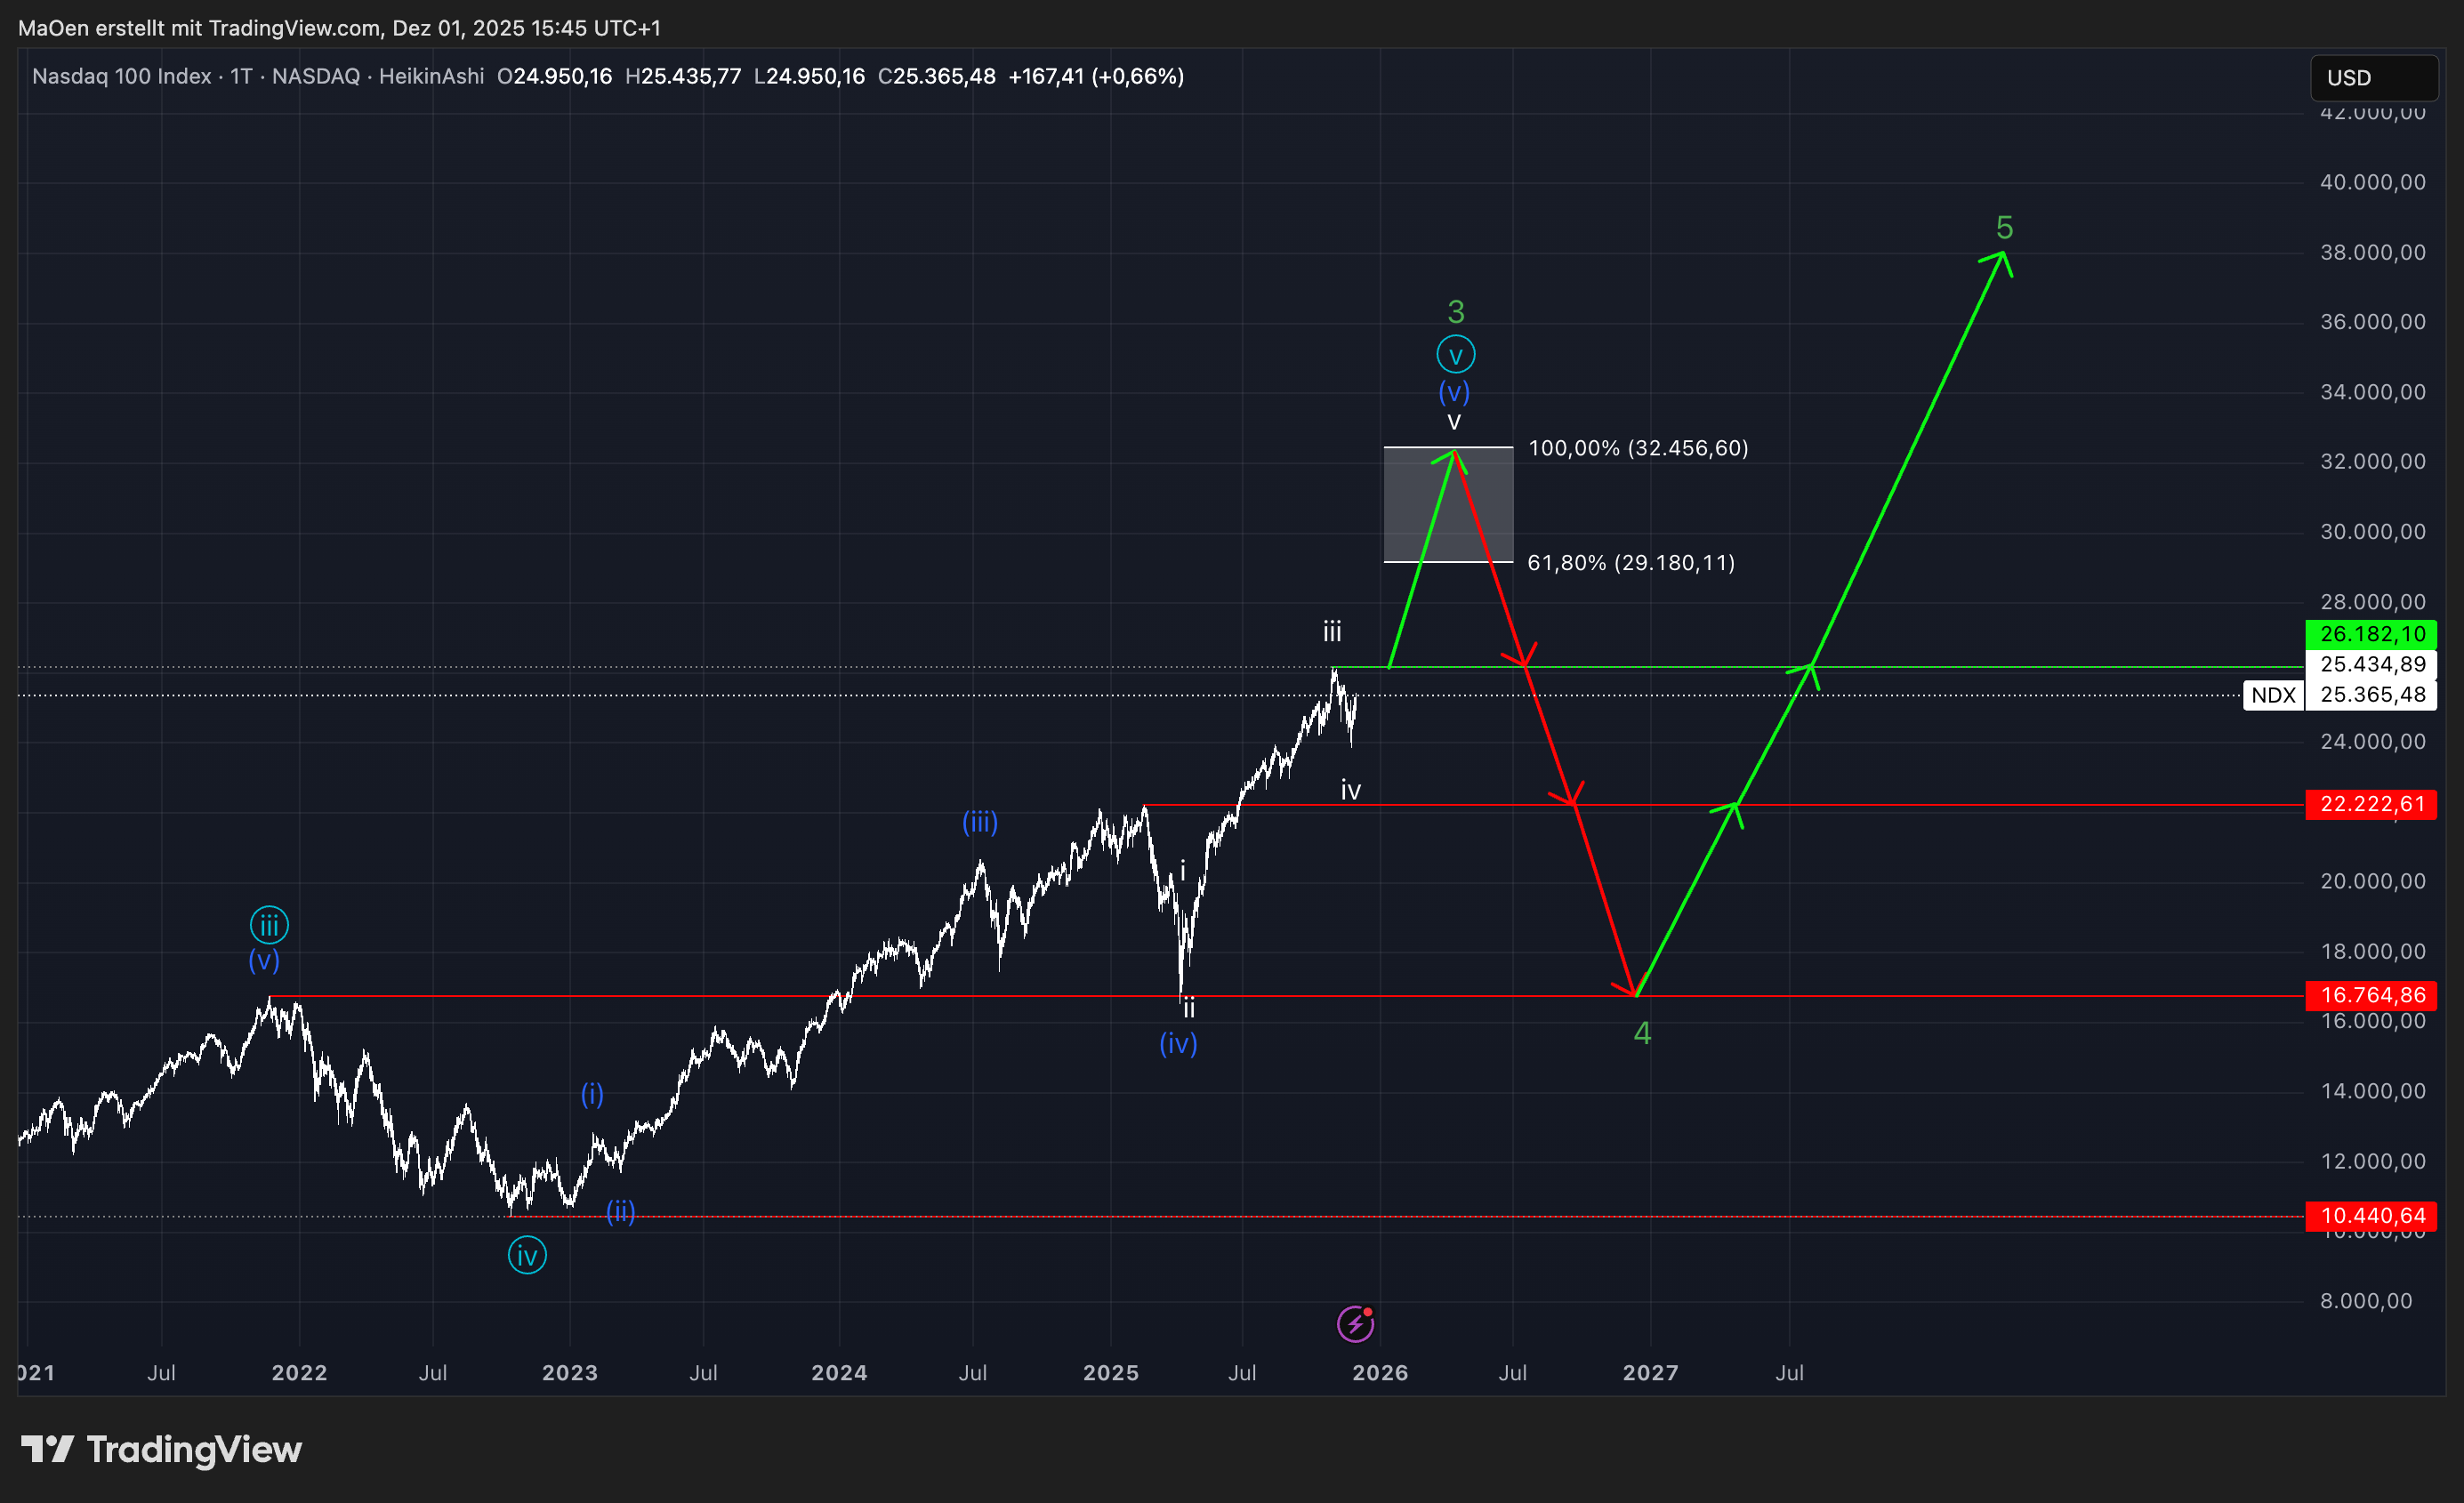
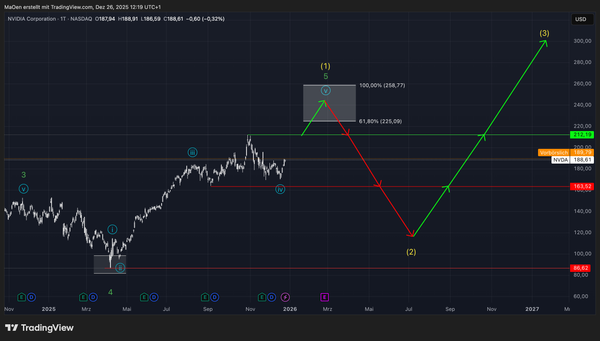
In our short-term outlook, we present a more detailed wave count that clearly indicates the expectation of one final new high in the Nasdaq before this index completes its current bullish structure. Based on the present wave configuration, we anticipate that the Nasdaq is in the final stages of completing its white cycle by producing white wave 5. A decisive move above the current all-time high at 26,182.10 points would finalize the white cycle and simultaneously complete the dark-blue cycle, which develops into light-blue wave 5. In the broader context, this entire structure terminates green wave 3 for the long run.
We have defined a projected price zone ranging from the 61.8% extension at 29,180.11 points up to the 100% extension at 32,456.60 points. This zone represents the region in which we expect the Nasdaq to top out and establish its final all-time high for long-term green wave 3. At the same time, this area serves as a shorting and profit-taking zoneahead of the upcoming corrective phase.
Trading Plan:
Our trading strategy remains straightforward:
We will wait for the Nasdaq to enter our projected price range. Within this zone, we intend to initiate short positions and realize profits from select long-term holdings. Should the Nasdaq validate our trading plan by completing the expected top, we plan to re-accumulate and close short positions once the index reaches the projected termination area of the upcoming long-term corrective green wave 4. For this wave 4, we will define a dedicated Fibonacci retracement zone, which will act as a long-term accumulation zone for the Nasdaq.
At the moment, we hold a bearish outlook on the Nasdaq.
If any structural changes arise or the index enters our projected price range, we will provide an immediate update.
Kind regards,
Monalytics