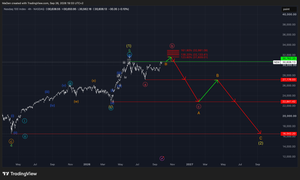
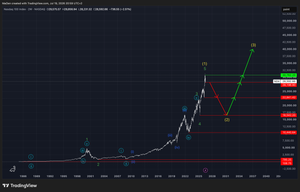
The Nasdaq has demonstrated a significant uptrend over the past years. However, we expect this index to enter a major corrective phase — one that will not break the long-term uptrend, but is anticipated to shake the broader market considerably.
That said, a market correction of this magnitude represents one of the greatest opportunities investors will get to establish positions across the markets. We expect the Nasdaq to have successfully formed a major top at 30,762.20 points and to have already initiated a long-term correction.
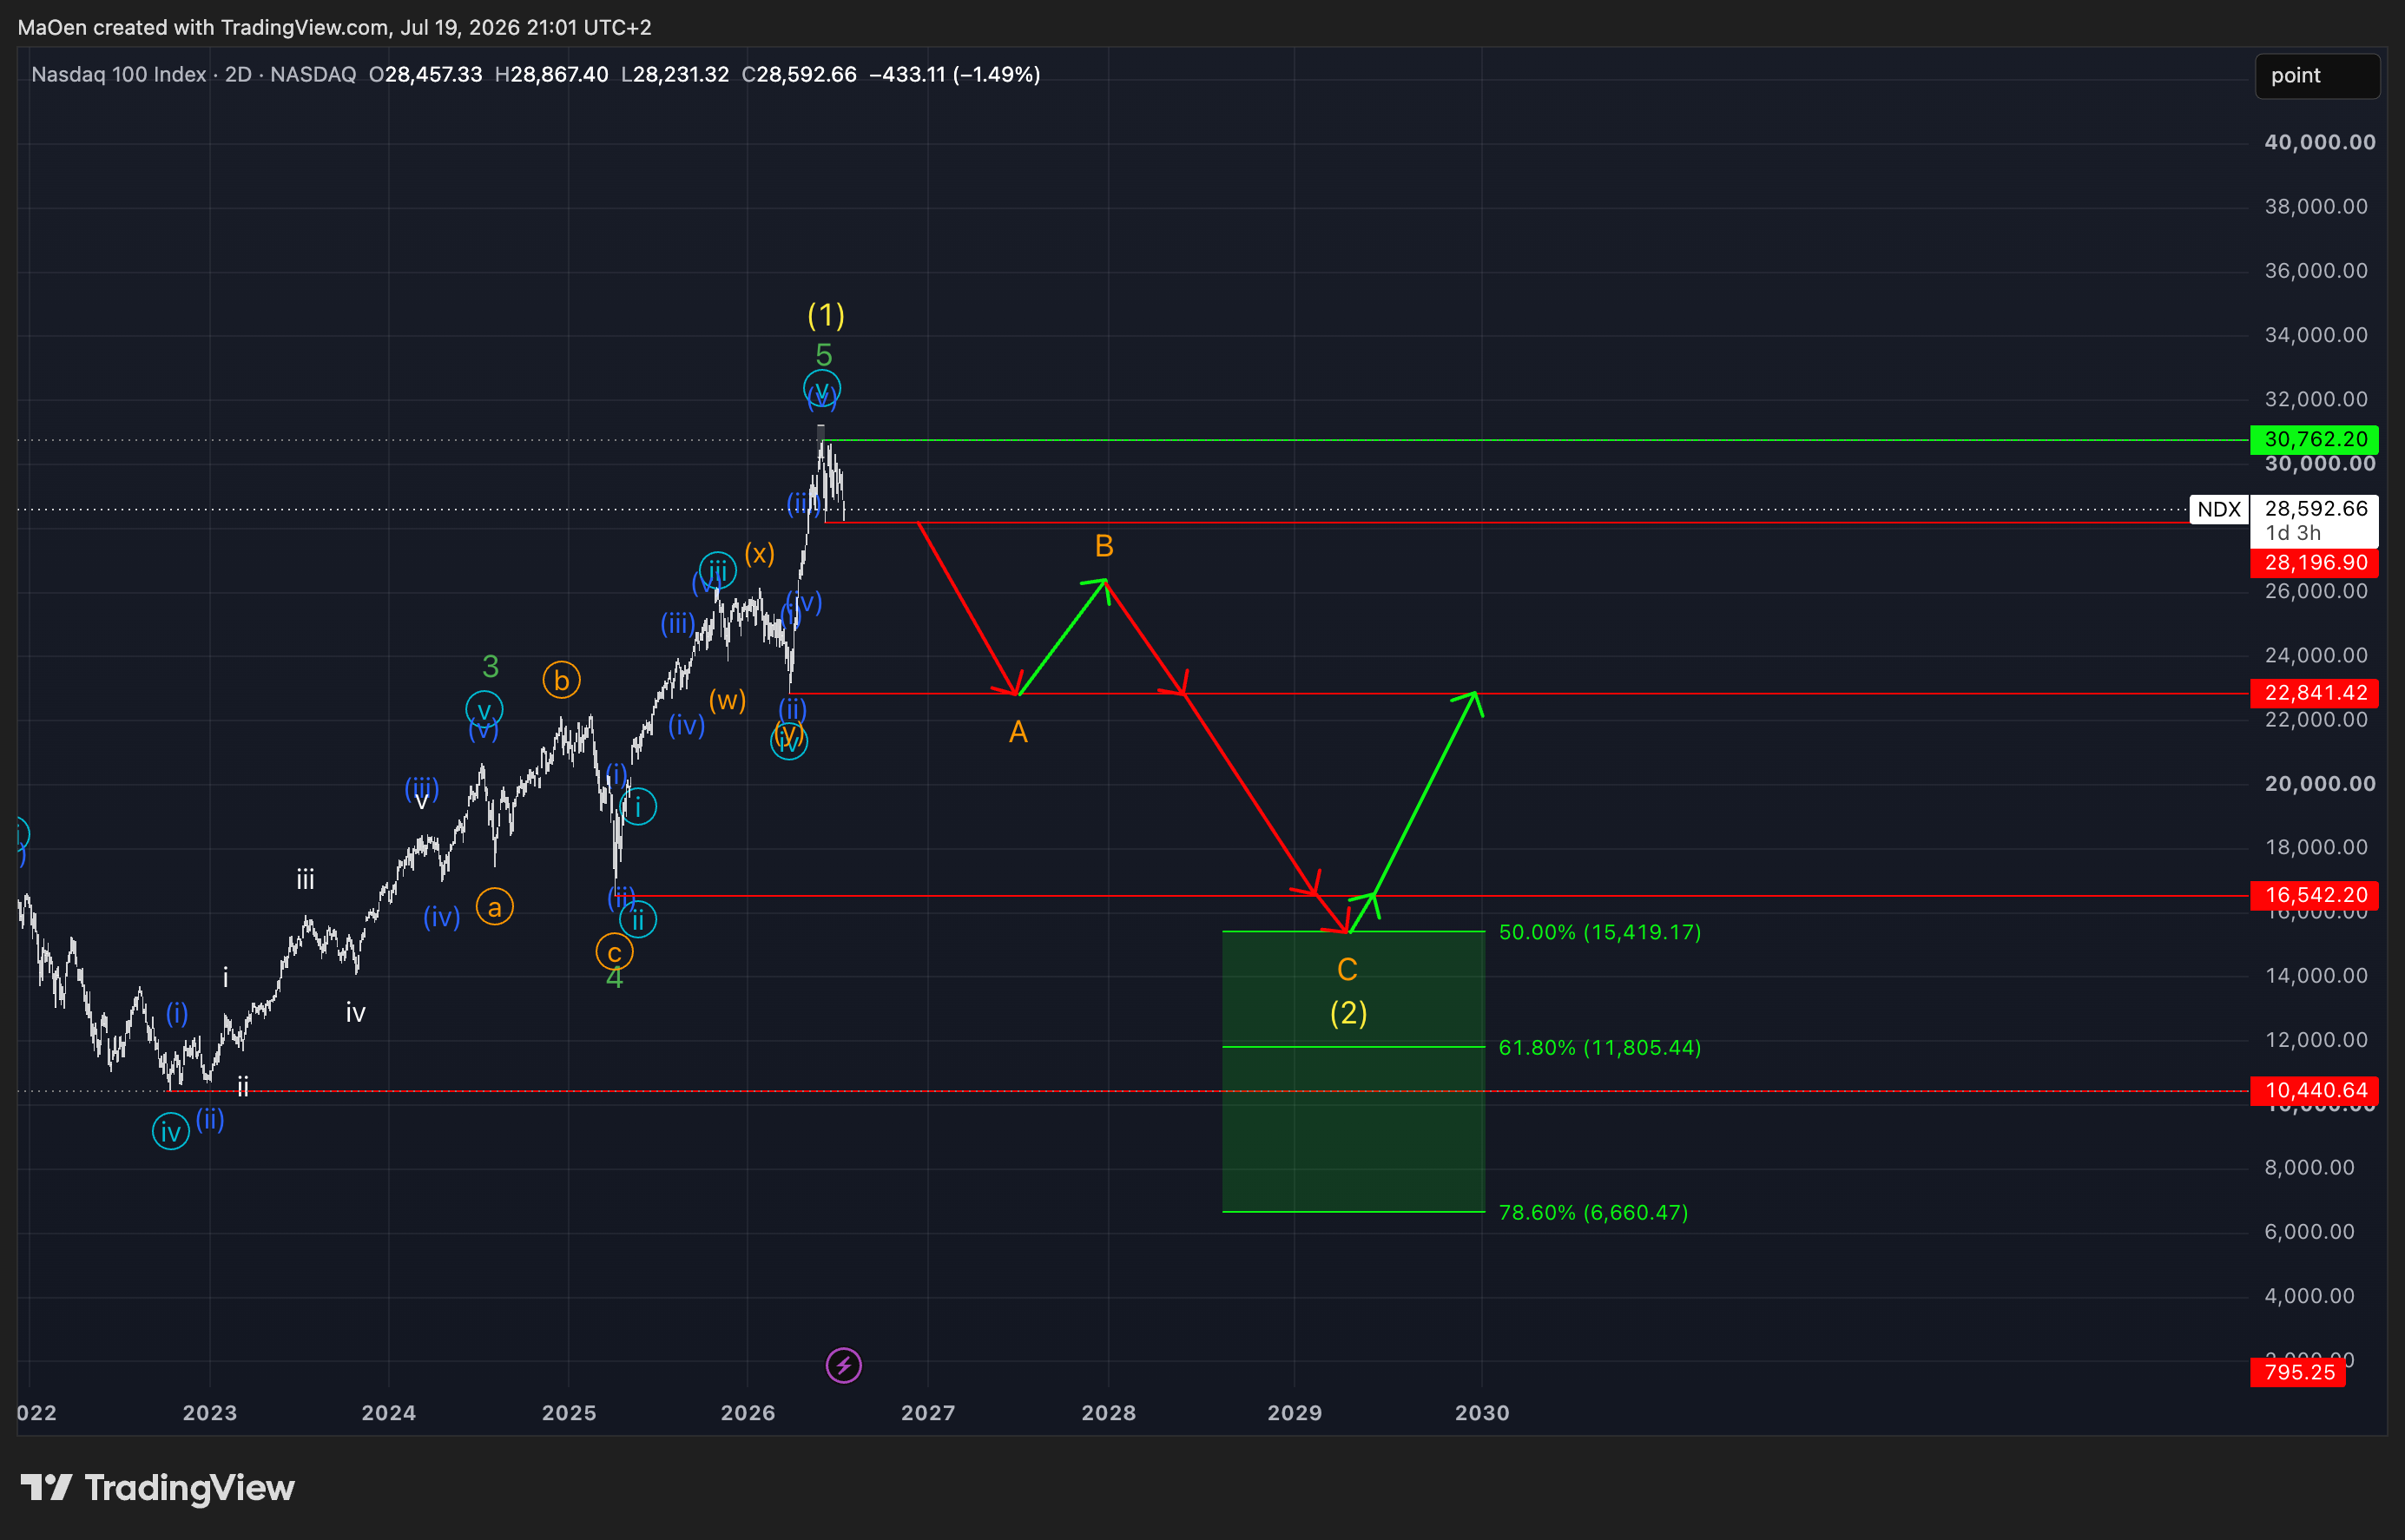
We expect this correction to unfold within a three-wave structure, developing as orange waves A, B, and C. For the conclusion of this correction, we have defined a Fibonacci retracement zone where we anticipate this corrective phase to end — presenting a prime opportunity to buy and accumulate this index.
We firmly believe that a correction of this magnitude will represent a historically significant chance to establish positions in this index and across the broader markets.
Should anything happen with this index, we will update you immediately.
Kind regards,
Monalytics
DISCLAIMER: The content on this website, including charts, analyses, and recommendations, is for informational purposes only and does not constitute financial, investment, or professional advice. Trading and investing involve risk. You should consult a qualified financial advisor before making any investment decisions.