Microsoft (MSFT) Update
Microsoft breaks expectations and initiates the first bearish movements
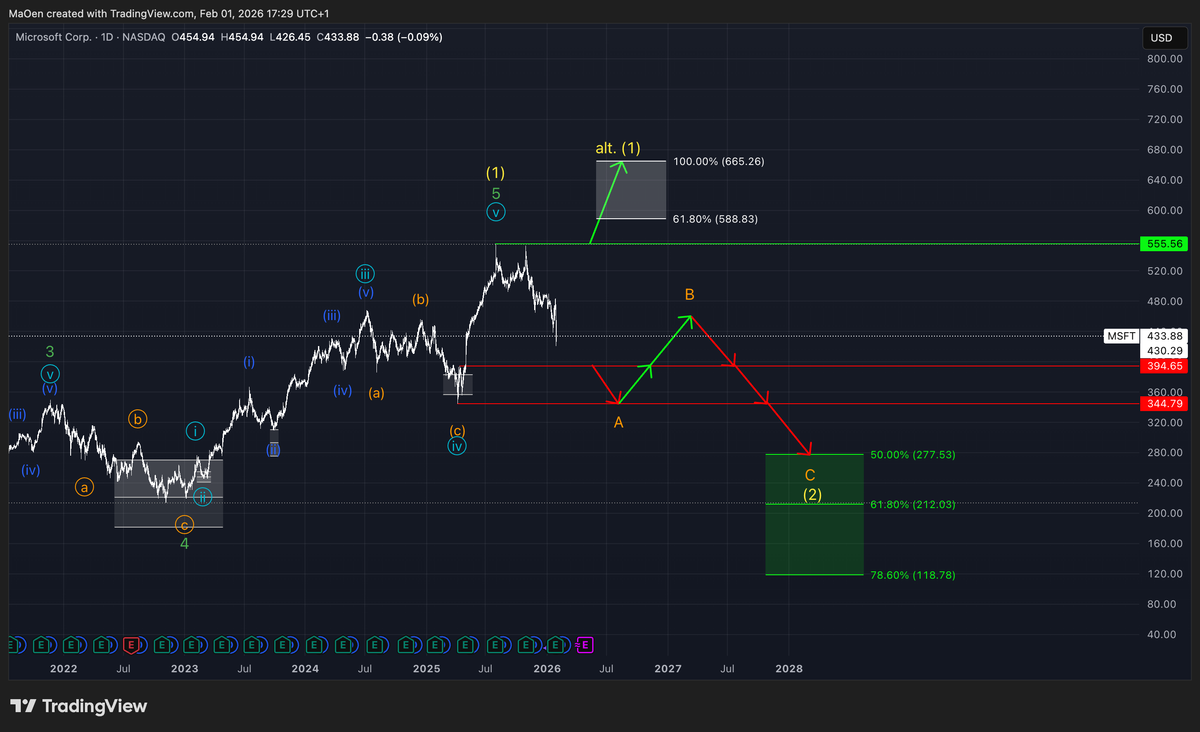
Microsoft has broken our initial expectations and is showing early signs of bearish price action. We originally anticipated that the stock would form one final all-time high before topping out, losing bullish momentum, and transitioning into a major corrective phase.
However, current market behavior suggests that Microsoft may have already completed its top within yellow wave 1 and has now begun its long-term correction into yellow wave 2. We expect this correction to unfold in a classic three-wave structure—orange wave A, B, and C—which would complete yellow wave 2. This represents our primary scenario.
That said, the market also presents a secondary scenario, which we currently assign a lower probability but still consider valid.
Secondary Scenario (Lower Probability)
In this alternative scenario, Microsoft has not yet completed yellow wave 1 and could still produce a new all-time high. We would anticipate this high to form within our projected price target zone, ranging from:
- 61.8% Fibonacci extension: $588.83
- 100% Fibonacci extension: $665.26
If Microsoft regains strong bullish momentum in the coming weeks or months, this scenario becomes increasingly likely. Even in this case, our long-term outlook remains unchanged: we would still expect the market to eventually form a major top (yellow wave 1) and then enter a substantial correction (yellow wave 2).If Microsoft loses the $394.65 price level (first red support level), the secondary scenario will be invalidated, and we will fully commit to our primary bearish outlook.
A break below $344.79 (second red support level) would likely trigger a deeper decline into our anticipated neon-green Fibonacci retracement zone, where orange wave C is expected to complete and terminate yellow wave 2.
This Fibonacci retracement zone ranges down from:
- 50% retracement: $277.53
- 61.8% retracement: $212.03
- 78.6% retracement: $118.78
From our perspective, these levels represent prime long-term buy and accumulation levels for Microsoft.
If any structural changes occur, or if price reaches one of our marked support levels or Fibonacci zones, we will provide updates immediately.
Kind regards,
Monalytics
DISCLAIMER: The content on this website, including charts, analyses, and recommendations, is for informational purposes only and does not constitute financial, investment, or professional advice. Trading and investing involve risk. You should consult a qualified financial advisor before making any investment decisions.