Microsoft - Long-term EW-Analysis
This chart represents our primary long term expectations for Microsoft.
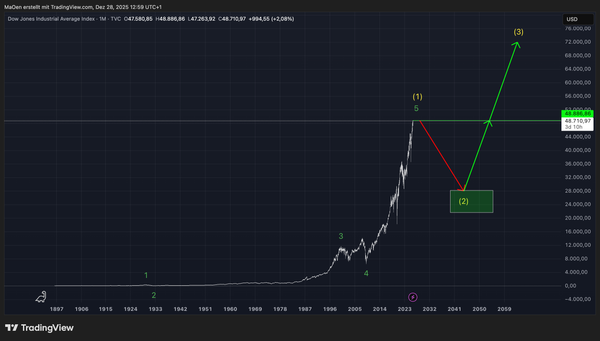
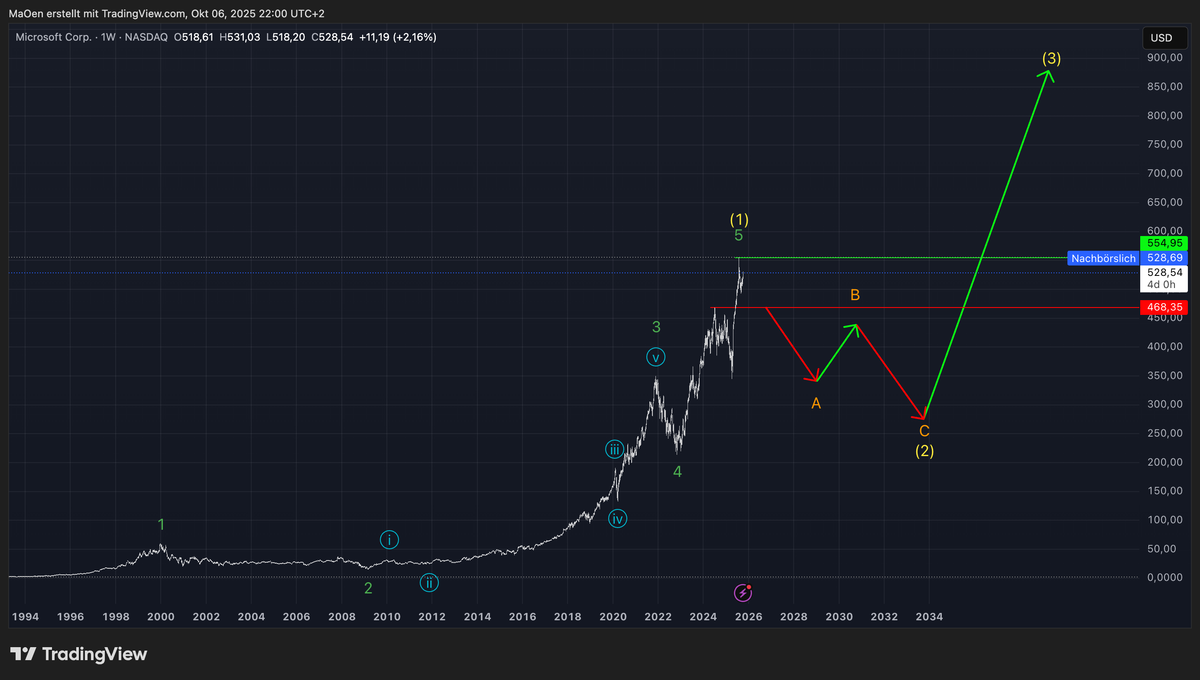
Microsoft’s stock appears to be approaching the completion of its long-term impulsive Wave (1) in yellow. With this move, the stock is likely to mark a new all-time high before entering the long-anticipated corrective phase in Wave (2) in yellow.
Once the top of Wave (1) is confirmed and the price breaks below the local support at $468.35, we expect the market to begin forming the initial structure of Wave (2). This correction will likely unfold in a three-wave (A–B–C) formation, serving as a natural retracement within the broader bullish cycle.
Despite the upcoming corrective potential, our short-term and long-term outlook remains bullish. Upon the completion of Wave (2), we anticipate the beginning of an extended impulsive advance in Wave (3) in yellow, which should carry prices well beyond the highs established in Wave (1).
Trading Plan:
In our mid- short-term analysis, we continue to monitor price action closely to identify the completion point of Wave (1). Once the market confirms a major top, we will outline a Fibonacci retracement target zone for Wave (2). This area is expected to offer high-probability buying opportunities as the market establishes a solid foundation for the next bullish impulse in Wave (3).
This outlook reflects our primary expectation for Microsoft`s long-term performance. Always ensure that you review our long-term projections first before moving on to our mid- and short-term Elliott Wave analyses.