Meta EW-Analysis
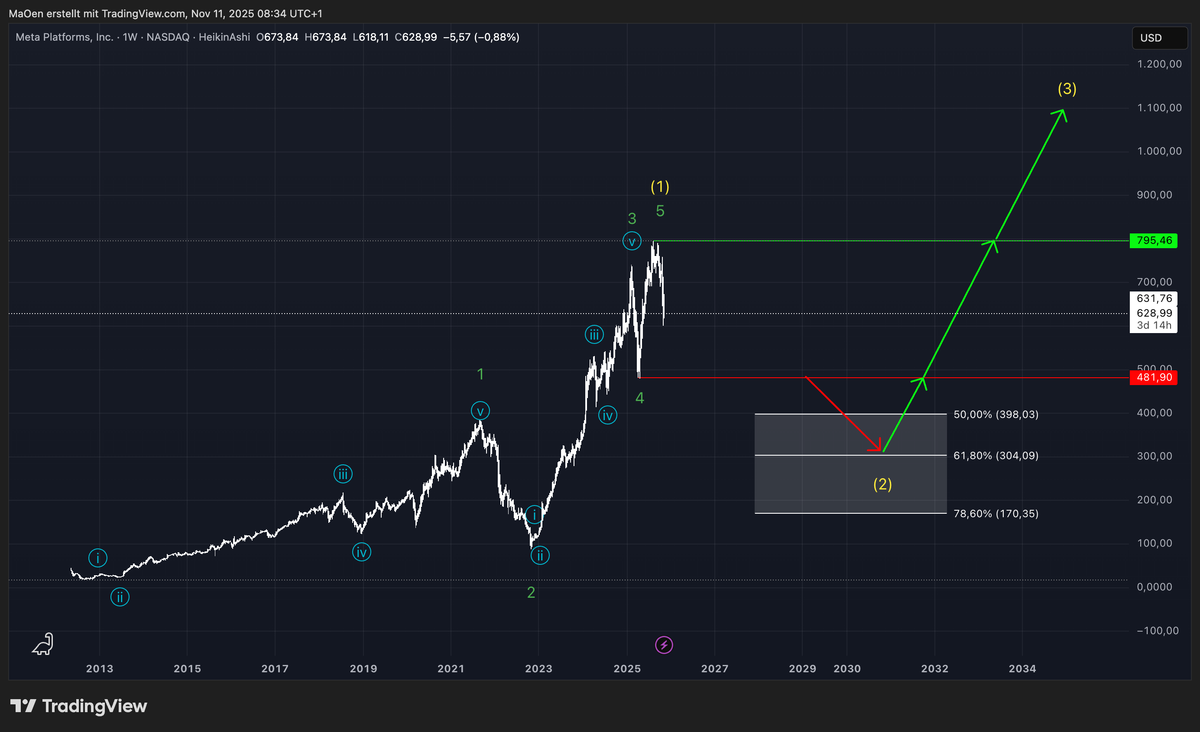
Meta Platforms has been developing a long-term bullish impulse (green), unfolding as part of a larger Wave 1 sequence(yellow). Since late 2012, the stock has been advancing in a sustained impulsive structure that now appears to be approaching its final stages of completion.
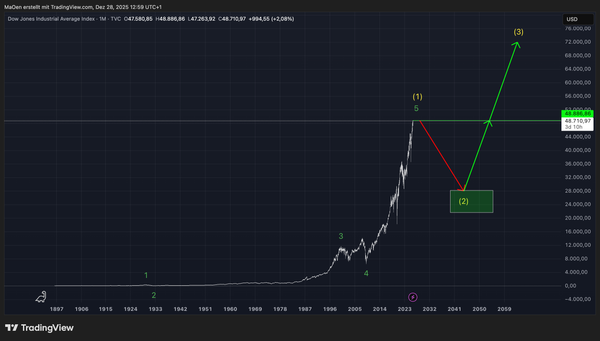
This chart outlines our long-term Elliott Wave count, which anticipates Meta completing its yellow Wave 1 before entering a corrective phase as yellow Wave 2. For this anticipated retracement, we have identified a Fibonacci support zone where we expect the corrective decline to lose bearish momentum and pave the way for the next impulsive advance.
This Fibonacci retracement zone spans from the 50% level at $397.78 down to the 78.6% level at $170.25. Within this range, we expect the market to establish a structural low, setting the stage for a powerful long-term bullish Wave 3 to unfold.
Importantly, this broader outlook remains in line with our shorter-term projections, which currently present two potential near-term scenarios—both consistent with our overarching long-term bullish framework.
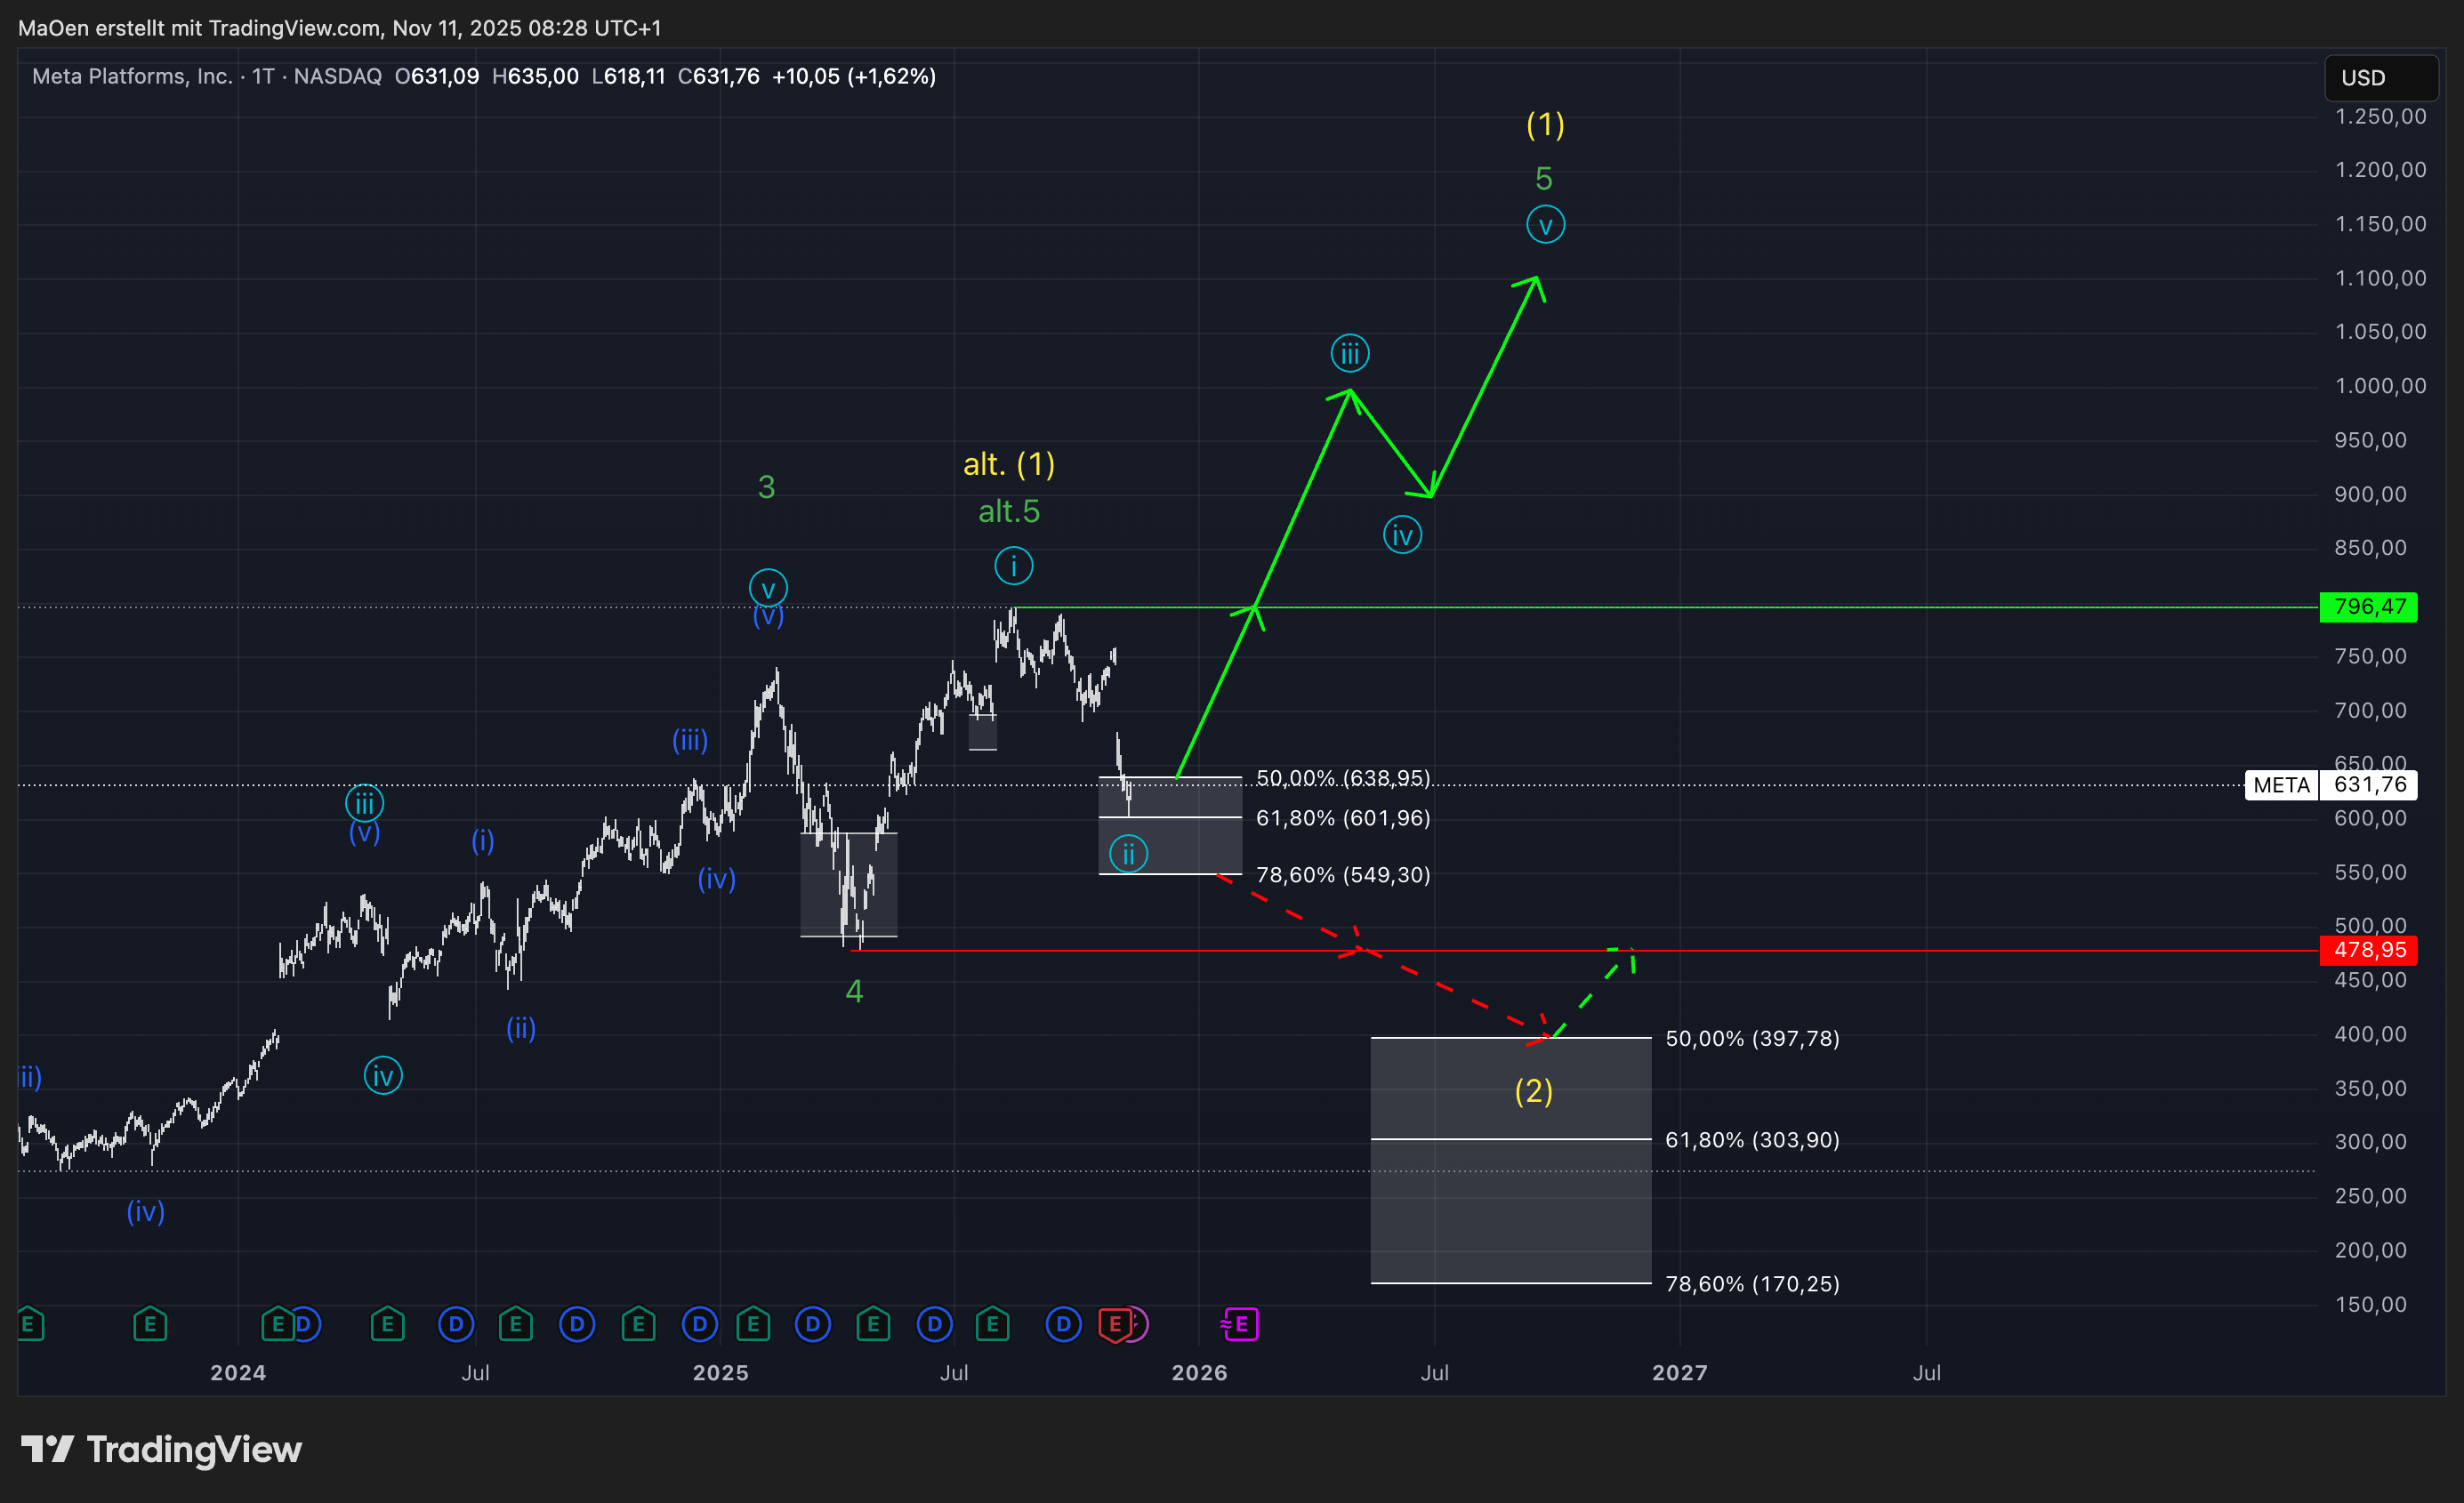
For the stock Meta, we currently identify two potential Elliott Wave scenarios—a primary bullish outlook and an alternative corrective view. While both align with our broader long-term structure, we assign higher probability to the primary scenario, which envisions further upside before a larger correction sets in.
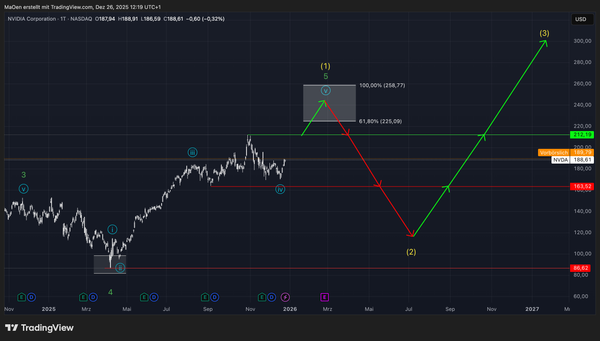
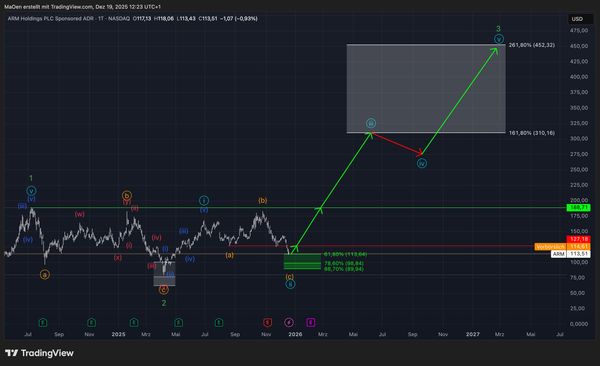
In our primary count, Meta has completed a light blue Wave 1 and subsequently corrected into a well-defined Fibonacci retracement zone, ranging from the 50% level at $638.95 to the 78.6% level at $549.30. Within this area, we anticipate the completion of light blue Wave 2, with bullish momentum expected to resume shortly, driving the stock into a powerful advance as light blue Wave 3.
This emerging impulsive phase should ultimately unfold as green Wave 5, thereby completing the entire yellow Wave 1 cycle on the long-term chart. A decisive breakout above the all-time high at $796.47 (highlighted in neon green) would serve as strong confirmation of this scenario, signaling the continuation of the broader bullish trend.
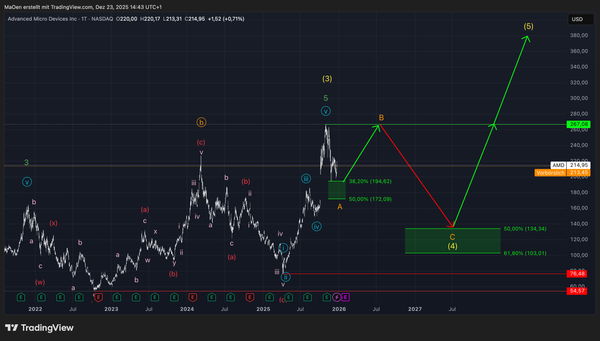
Our alternative count suggests that green Wave 5 and thus yellow Wave 1 may already be complete. In this case, Meta would currently be in the early stages of a corrective decline, marking the onset of yellow Wave 2. A confirmed breakdown below $478.95 (marked in red) would invalidate the primary count and confirm this bearish alternative.
Trading Plan:
We recommend traders focus primarily on the Fibonacci retracement zone for light blue Wave 2, which represents a strategic accumulation area and a high-probability buy opportunity within the context of our primary scenario. However, patience remains key—confirmation through a breakout or breakdown will provide critical validation. Should Meta enter a deeper correction into the long-term yellow Wave 2 retracement zone, that phase would likely present exceptional long-term entry opportunities—potentially at price levels that may not be revisited once the next major bullish cycle begins.