Intel (INTC) EW-Analysis
New Bullish Momentum After a 25-Year Correction
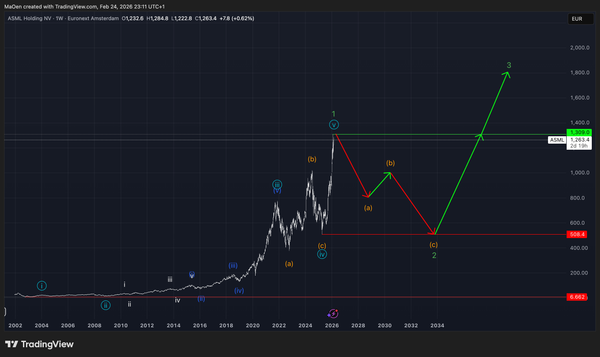
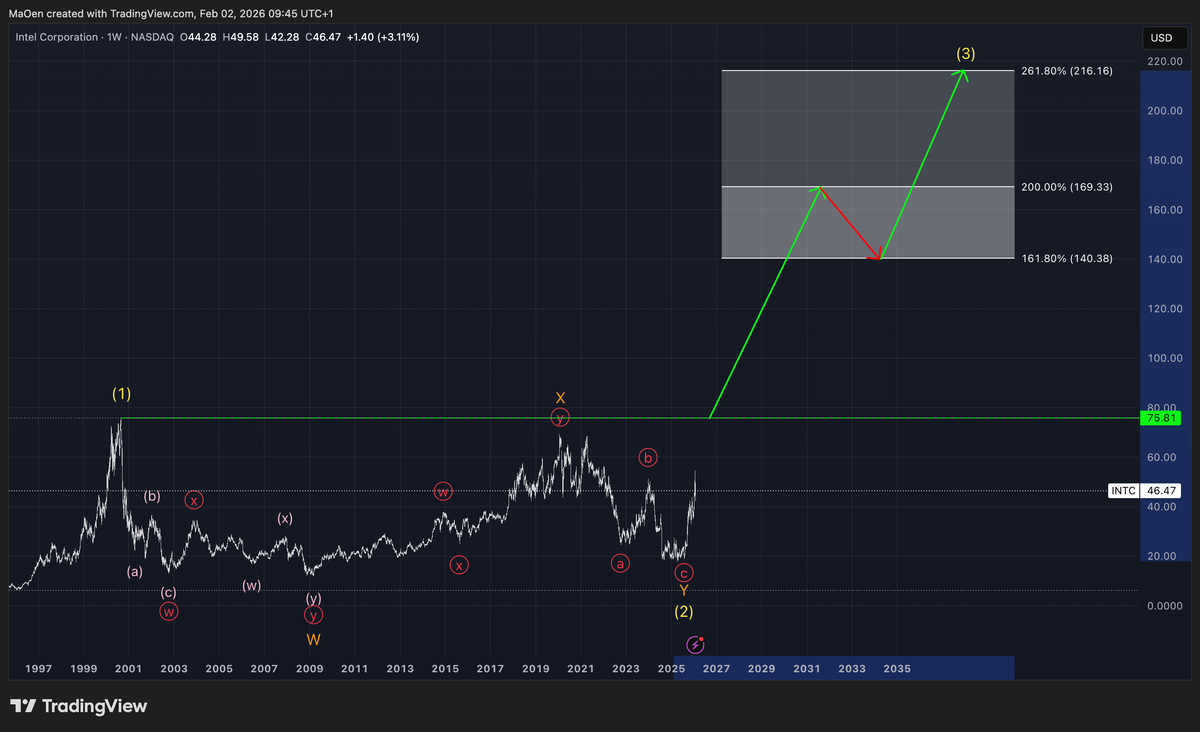
Since its IPO in 1971, Intel has completed a major long-term bullish cycle that culminated in the market high in 2000, marking the completion of yellow wave 1. From that peak, the stock entered a prolonged corrective phase, forming a large bearish yellow wave 2.
This corrective structure persisted for approximately 25 years, until Intel began to regain bullish momentum toward the end of 2025 and the beginning of 2026. With the completion of this long-term yellow wave 2, Intel has established a structural low, laying the foundation for a new secular bullish market.
Following the completion of yellow wave 2, Intel has now begun its initial impulsive movements, signaling the early stages of yellow wave 3. Historically, third waves tend to be the strongest and most extended phases in an Elliott Wave cycle, which supports expectations for a sustained long-term uptrend.
For yellow wave 3, we have defined a long-term price target zone based on Fibonacci extensions. This target zone ranges from:
- 161.8% extension at $140.38
- 200% extension at $169.33
- 261.8% extension at $216.16
These levels represent our long-term bullish outlook for Intel and align closely with our short-term technical analysis, which already indicates emerging bullish impulses. The current price action strongly suggests that the extended corrective phase of yellow wave 2 has concluded, and that Intel has entered a new long-term bullish cycle with the potential to reach new all-time highs over the coming years.
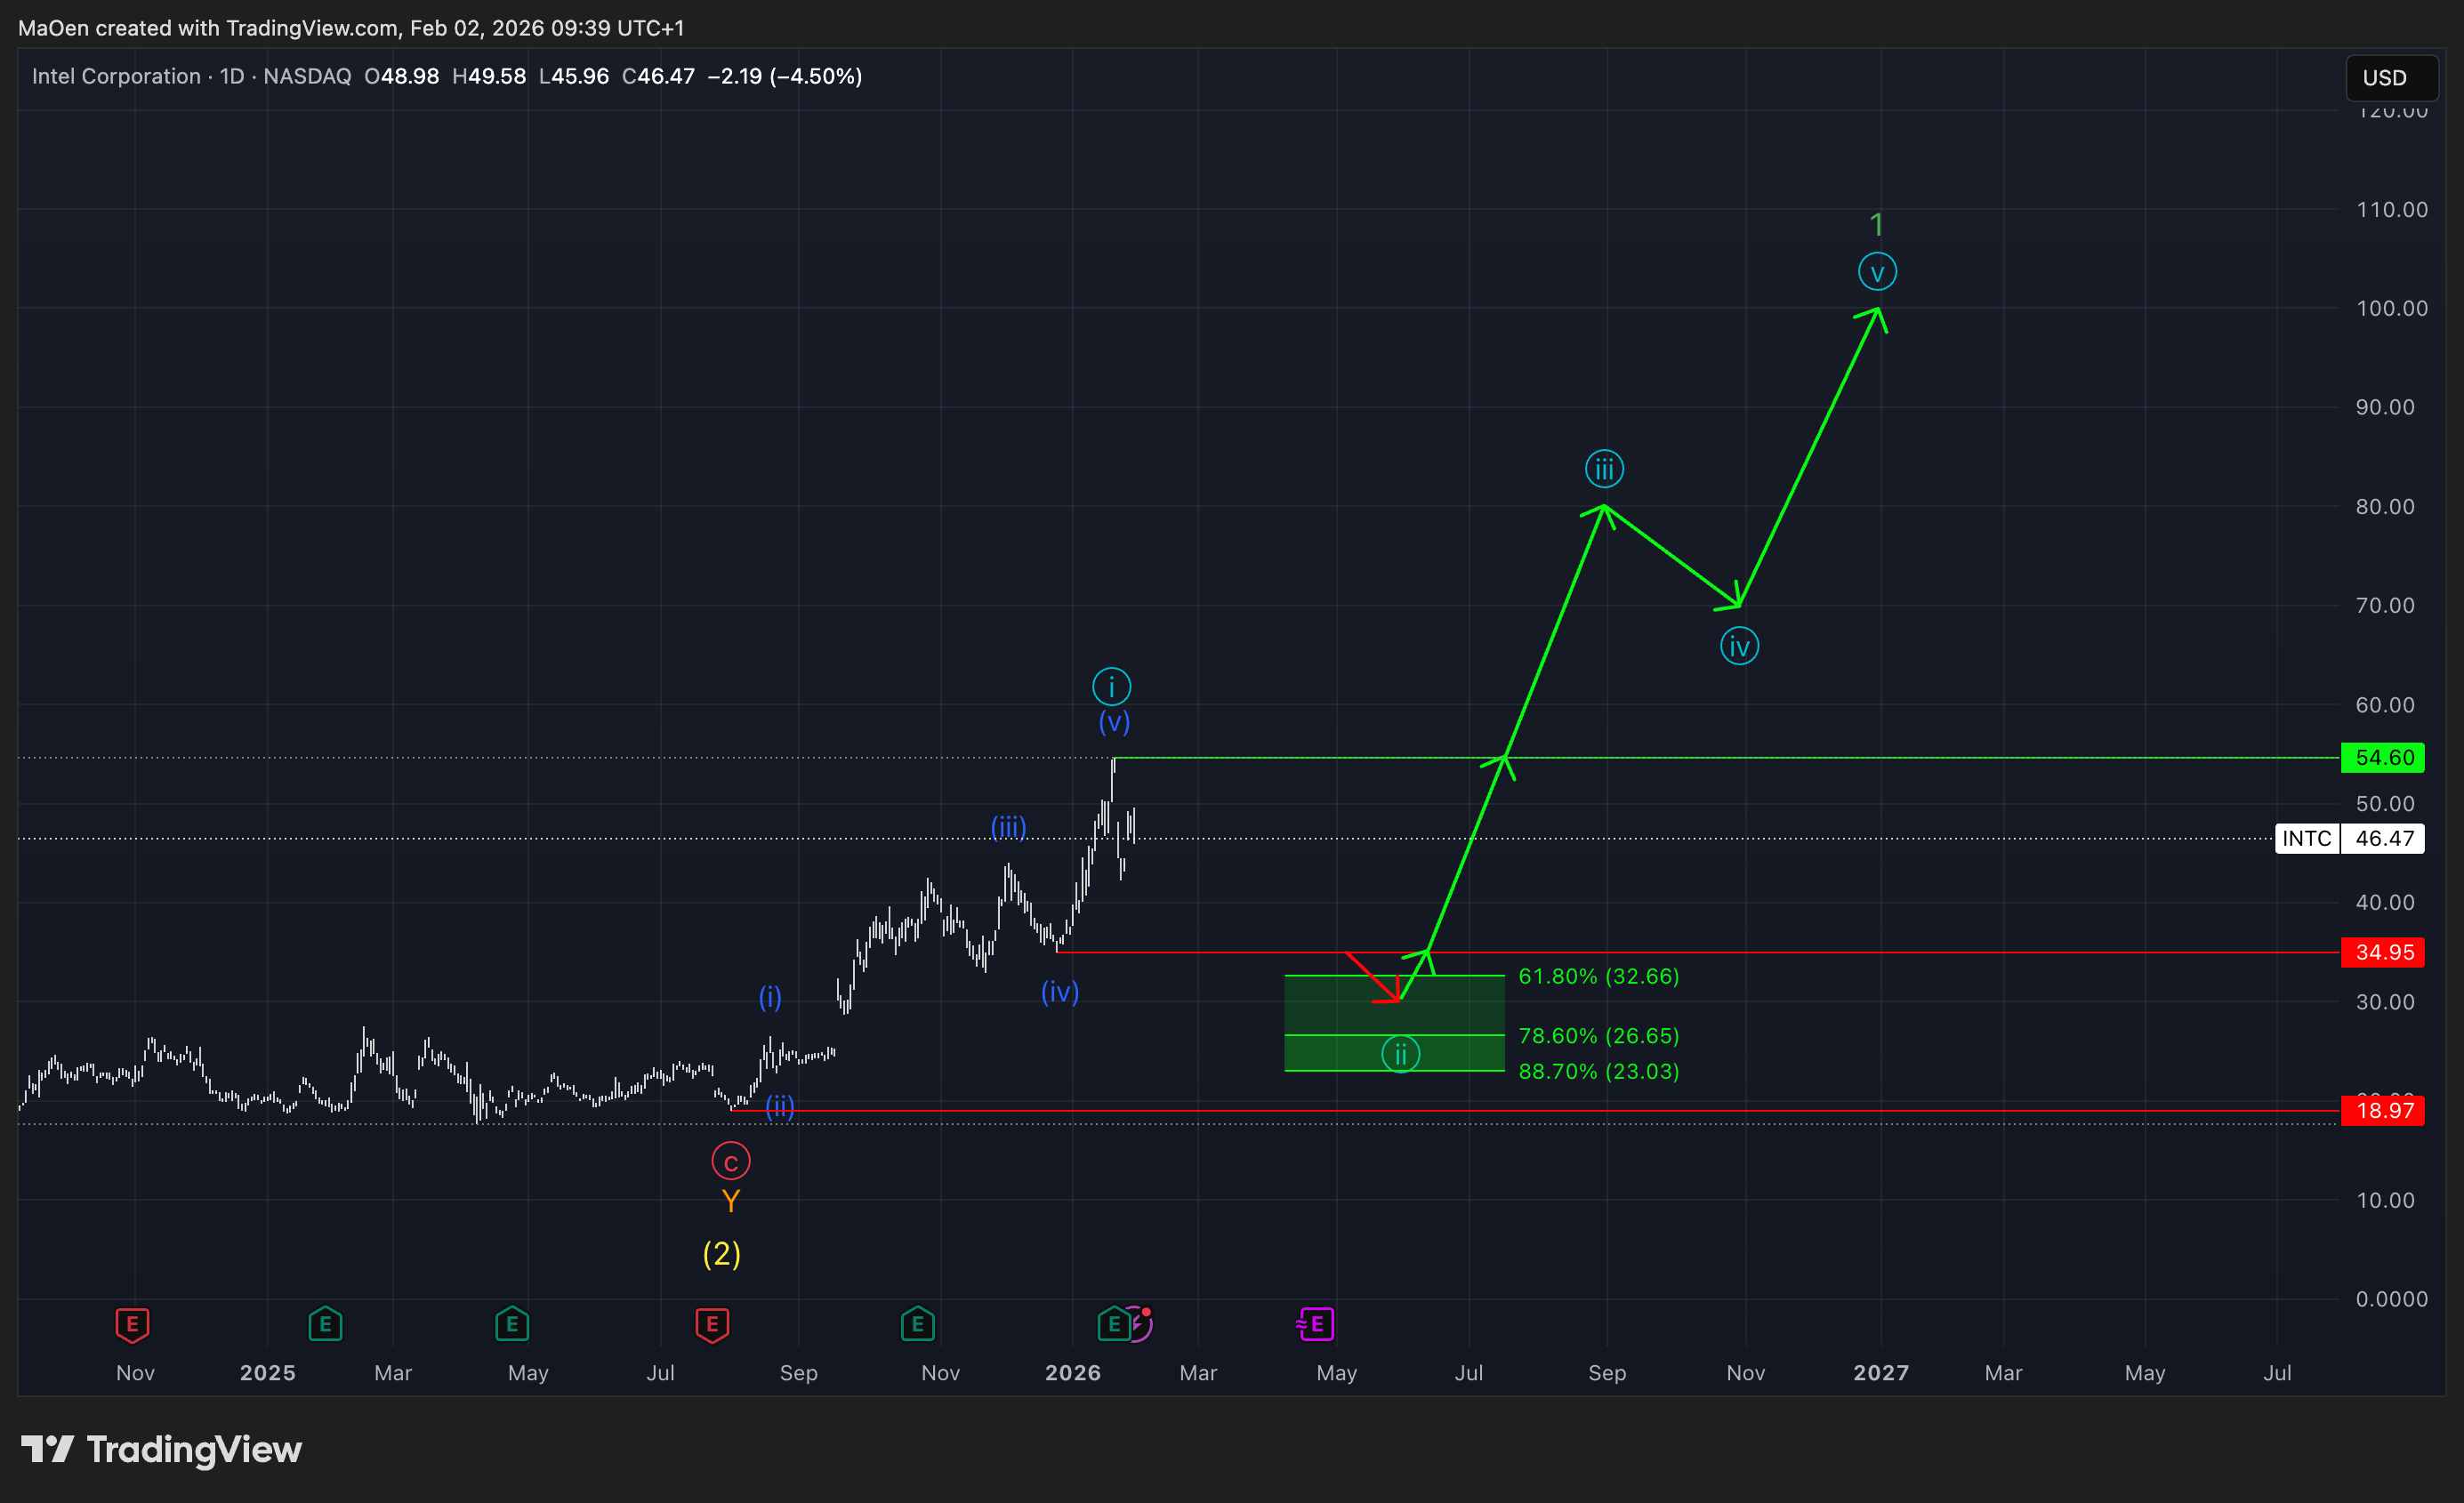
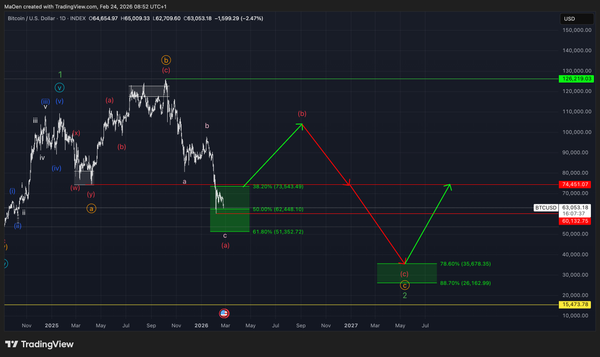
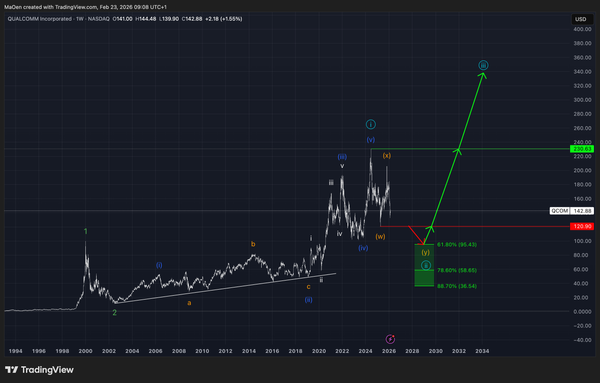
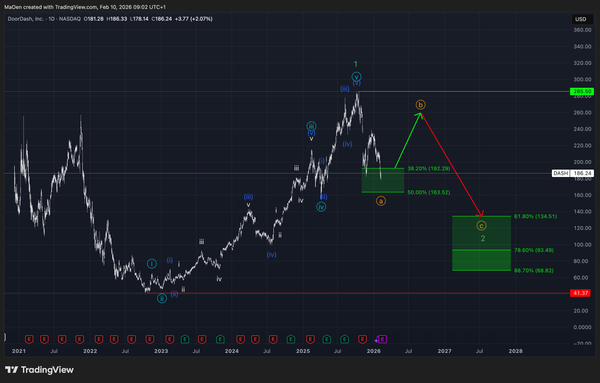
After the completion of yellow wave 2 at $18.97, Intel regained bullish momentum and formed light blue wave 1. This impulsive move has now been completed, and the market has transitioned into a short-term corrective phase, marking the development of light blue wave 2.
For this correction, we have defined a Fibonacci retracement zone in which light blue wave 2 is expected to terminate and renewed bullish momentum should emerge. This retracement zone ranges from:
- 61.8% at $32.66
- 78.6% at $26.65
- 88.7% at $23.03
In our view, this zone represents a high-probability accumulation area and offers attractive long-term entry levels that are unlikely to be seen again in the future.
Should price reach this retracement zone, we expect Intel to complete light blue wave 2 and begin a strong impulsive advance into light blue wave 3. This move should be followed by a brief corrective phase in light blue wave 4, and a final impulsive advance in light blue wave 5, completing the entire light blue wave cycle. This structure would then form green wave 1 on the next higher degree.
From our perspective, this market presents significant long-term opportunities that investors should not overlook.
If any structural changes occur or if Intel reacts within our defined buying zone, we will provide an update immediately.
Kind regards,
Monalytics
DISCLAIMER: The content on this website, including charts, analyses, and recommendations, is for informational purposes only and does not constitute financial, investment, or professional advice. Trading and investing involve risk. You should consult a qualified financial advisor before making any investment decisions.