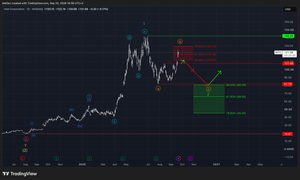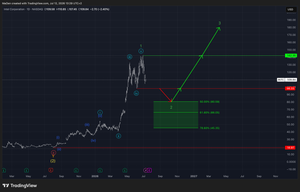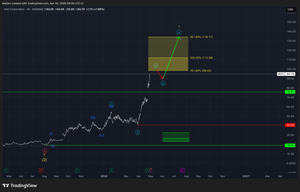
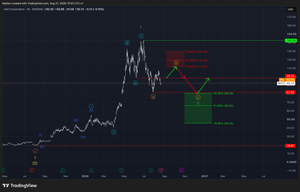
Intel has set a local top at $142.35 and has started a corrective phase to correct the entire fractal for green wave 1. However, this correction has already completed its first leg and is expected to flow into a short-term recovery phase.
For this recovery, we have set a Fibonacci retracement zone (in red), where this recovery will come to an end and form orange wave b. This zone represents a short-selling opportunity.
Short entry levels:
- 50% at $112.01
- 61.8% at $119.16
- 78.6% at $129.33
From there on, we expect the market to drop and reach our long-term Fibonacci retracement zone (in green). This zone represents a prime buying opportunity in the long term, at very cheap prices for this stock.
Long entry levels:
- 50% at $80.59
- 61.8% at $66.05
- 78.6% at $45.35
Within this zone, the whole correction should come to an end, and Intel should regain new bullish momentum to follow a long-term sustainable uptrend.
If anything happens with this stock, we will update you immediately.
Kind regards,
Monalytics
DISCLAIMER: The content on this website, including charts, analyses, and recommendations, is for informational purposes only and does not constitute financial, investment, or professional advice. Trading and investing involve risk. You should consult a qualified financial advisor before making any investment decisions.