

Understanding our analysis means understanding our reasoning — not just what we expect to happen, but why. The way we count the Elliott Wave structure directly shapes how and when we trade, and we want our members to follow that logic clearly at every step.
(We recommend reading the Elliott Wave Theory guide first before starting this trading guide (. It will be much easier to follow once you are familiar with how we count Bitcoin's structure in this example using Elliott Wave and Fibonacci.)
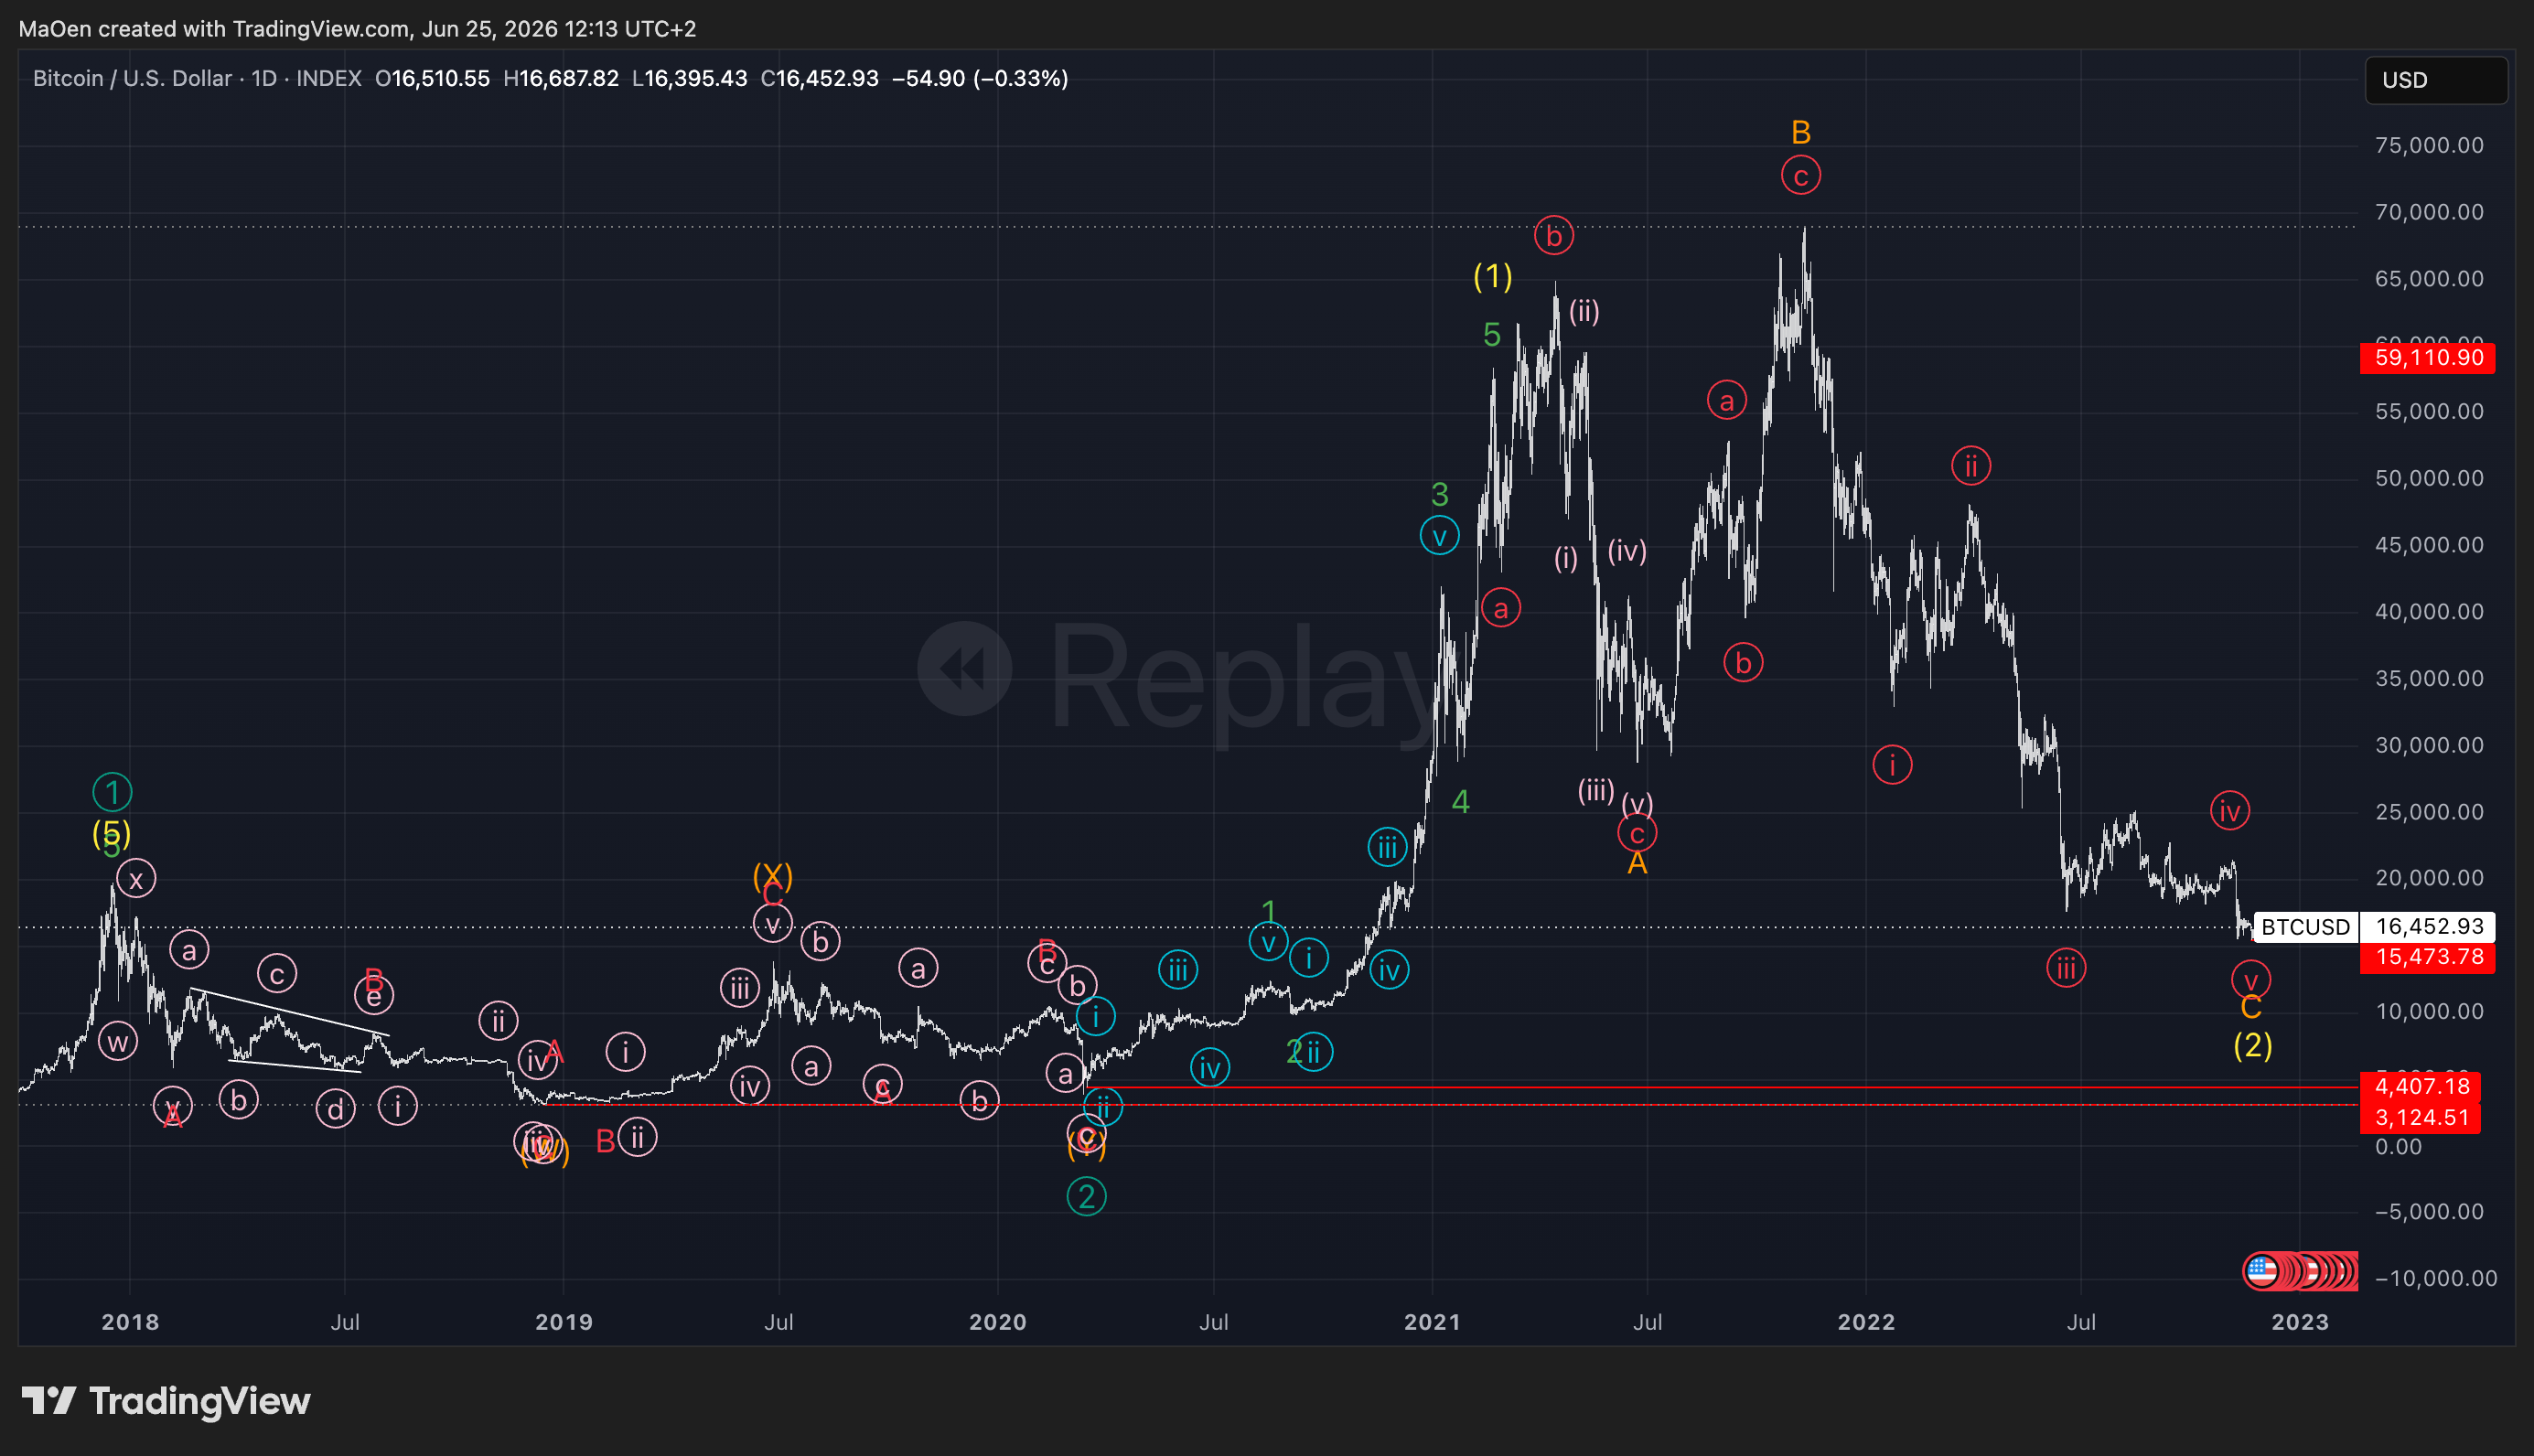
This long-term chart gives you the full context for everything that follows. You don't need to understand every wave on it — the only thing that matters is this: Bitcoin has just completed a major long-term correction into yellow wave 2, ending a cycle that began with the 2021 bull run peak at $68,000. We are now at the exact bottom of that correction, and this is the starting point of our entire example. Every zone, every entry, and every wave count in this guide plays out from this moment forward.
Now let's zoom in. The following charts will walk you through our analysis step by step — starting with identifying the bottom and building the first Fibonacci zone.
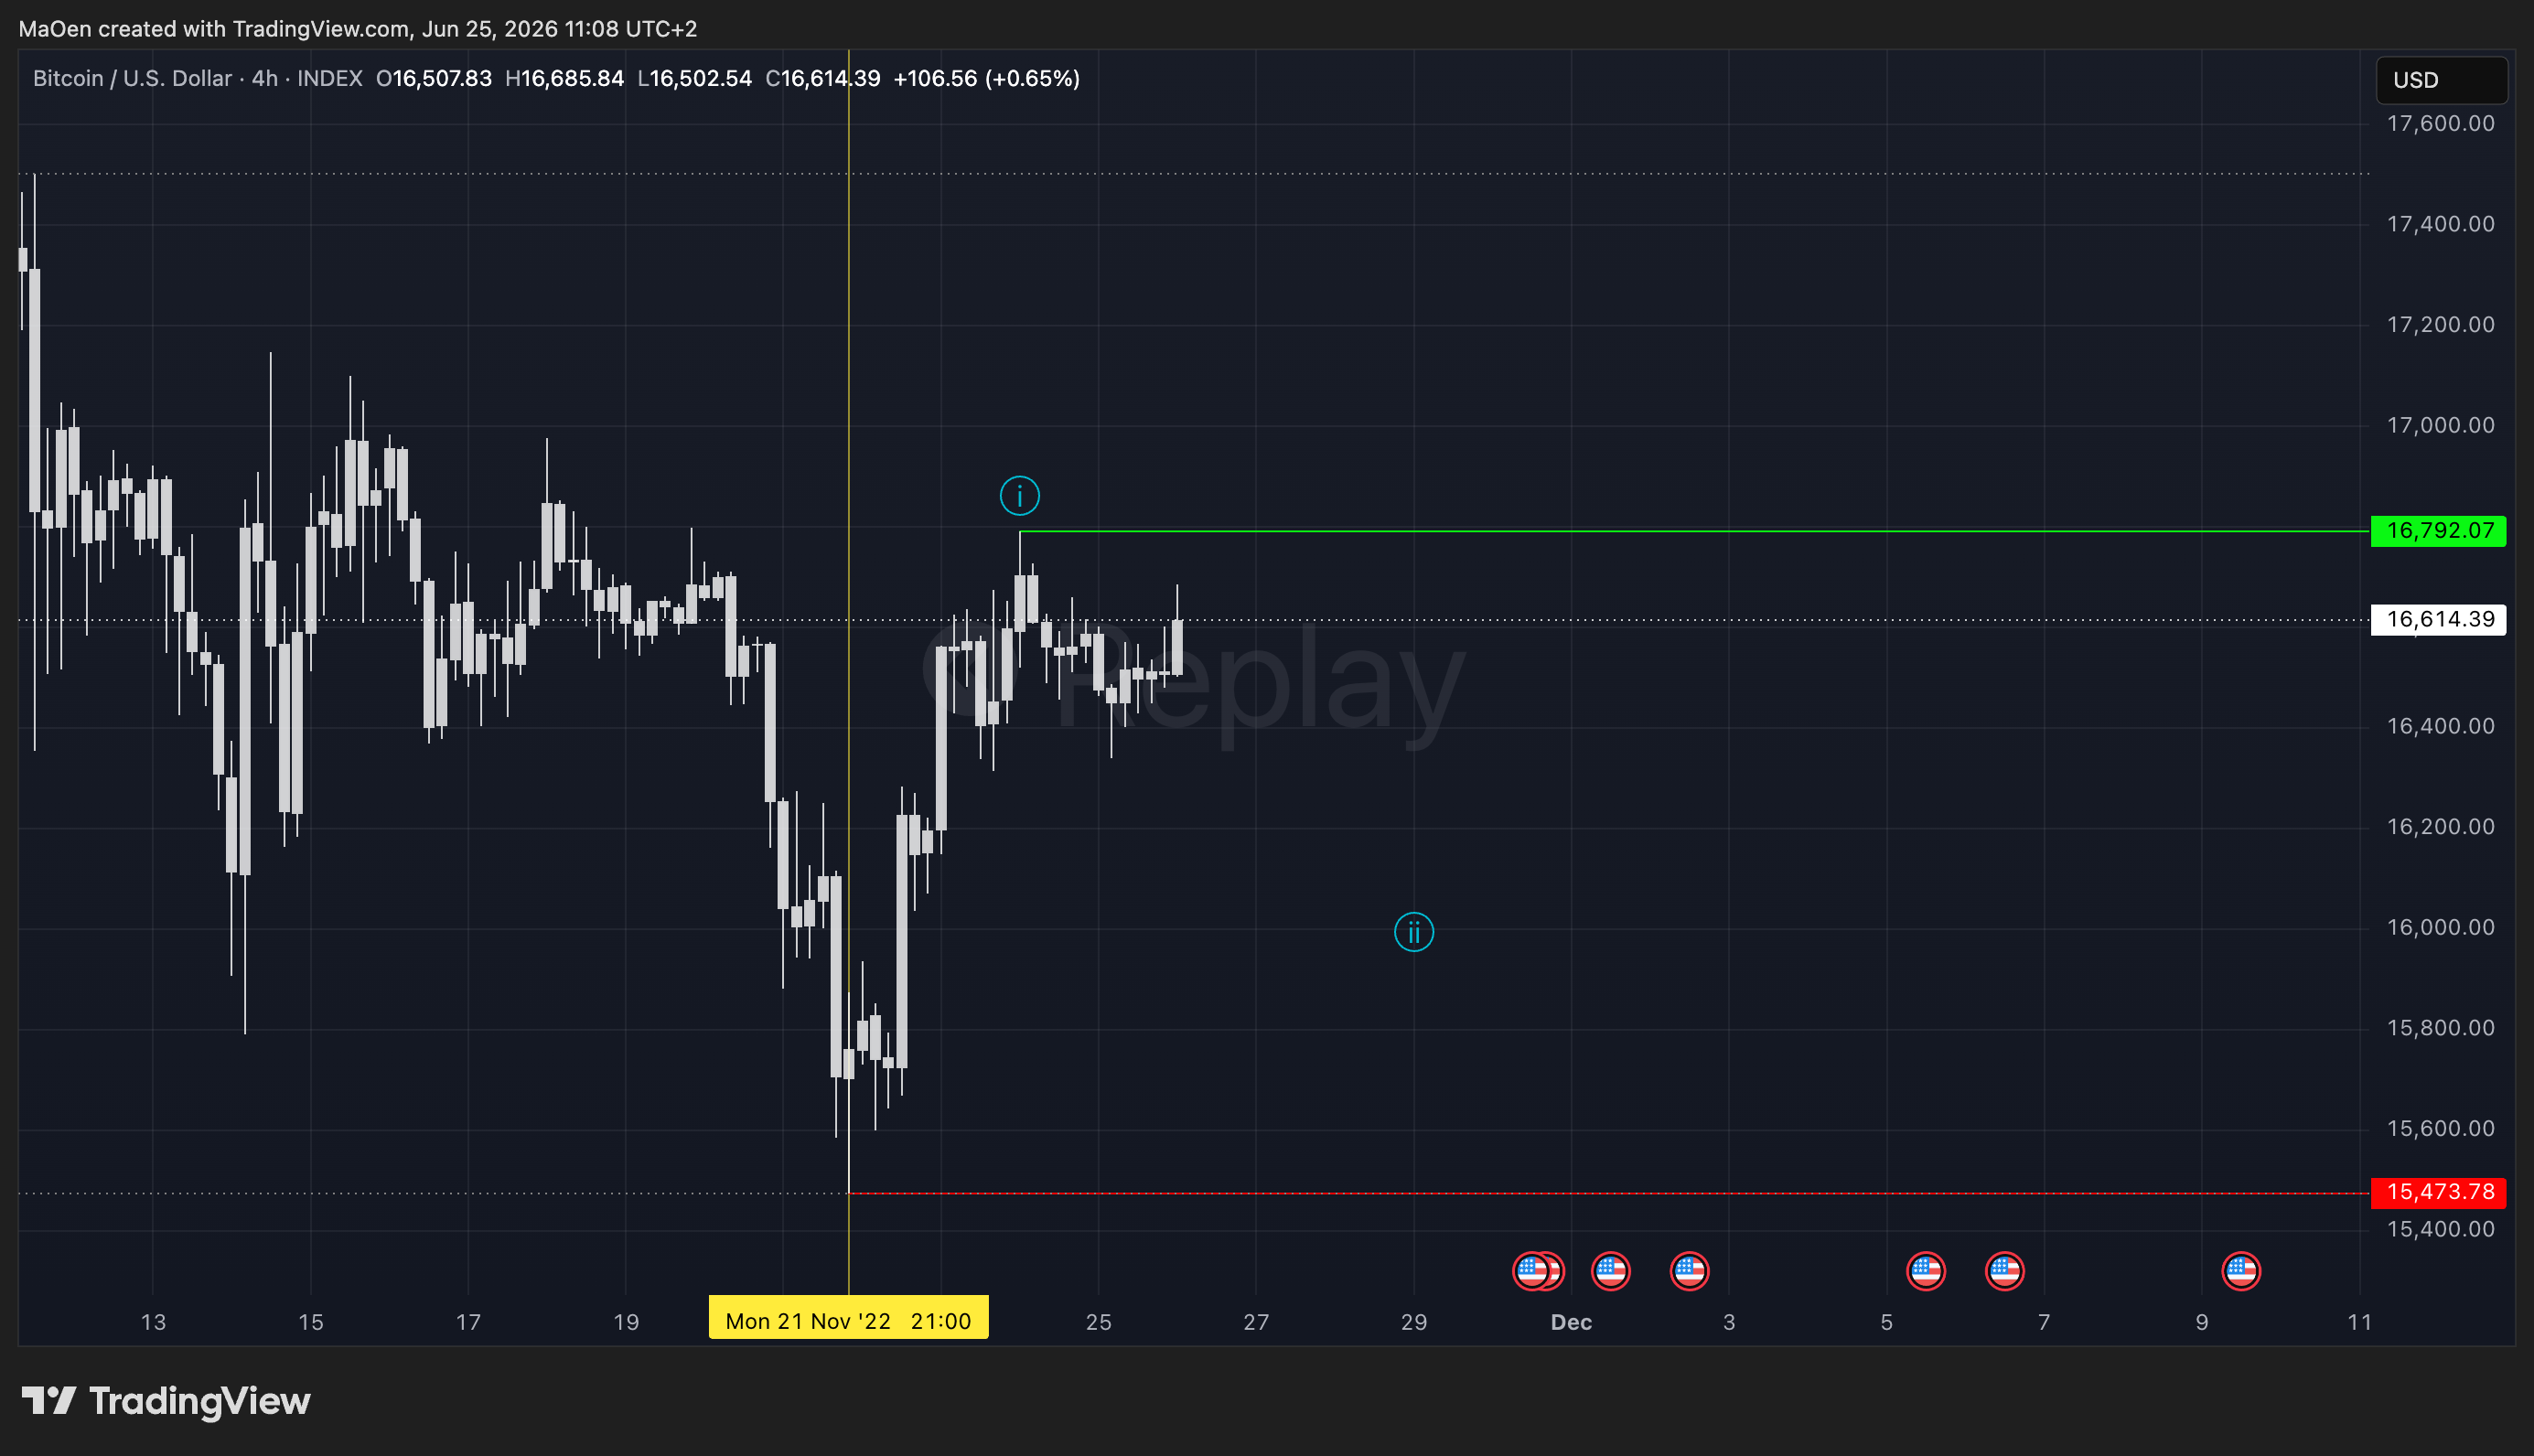
The moment we identify an impulsive movement off significant lows, our process begins. In this case, Bitcoin set its bottom at $15,473 on November 21st and immediately built a first impulsive move higher — light blue wave 1 on the 4-hour chart. This is our first signal. We are now ready to set a Fibonacci retracement zone, and we speculate that the bottom is confirmed.
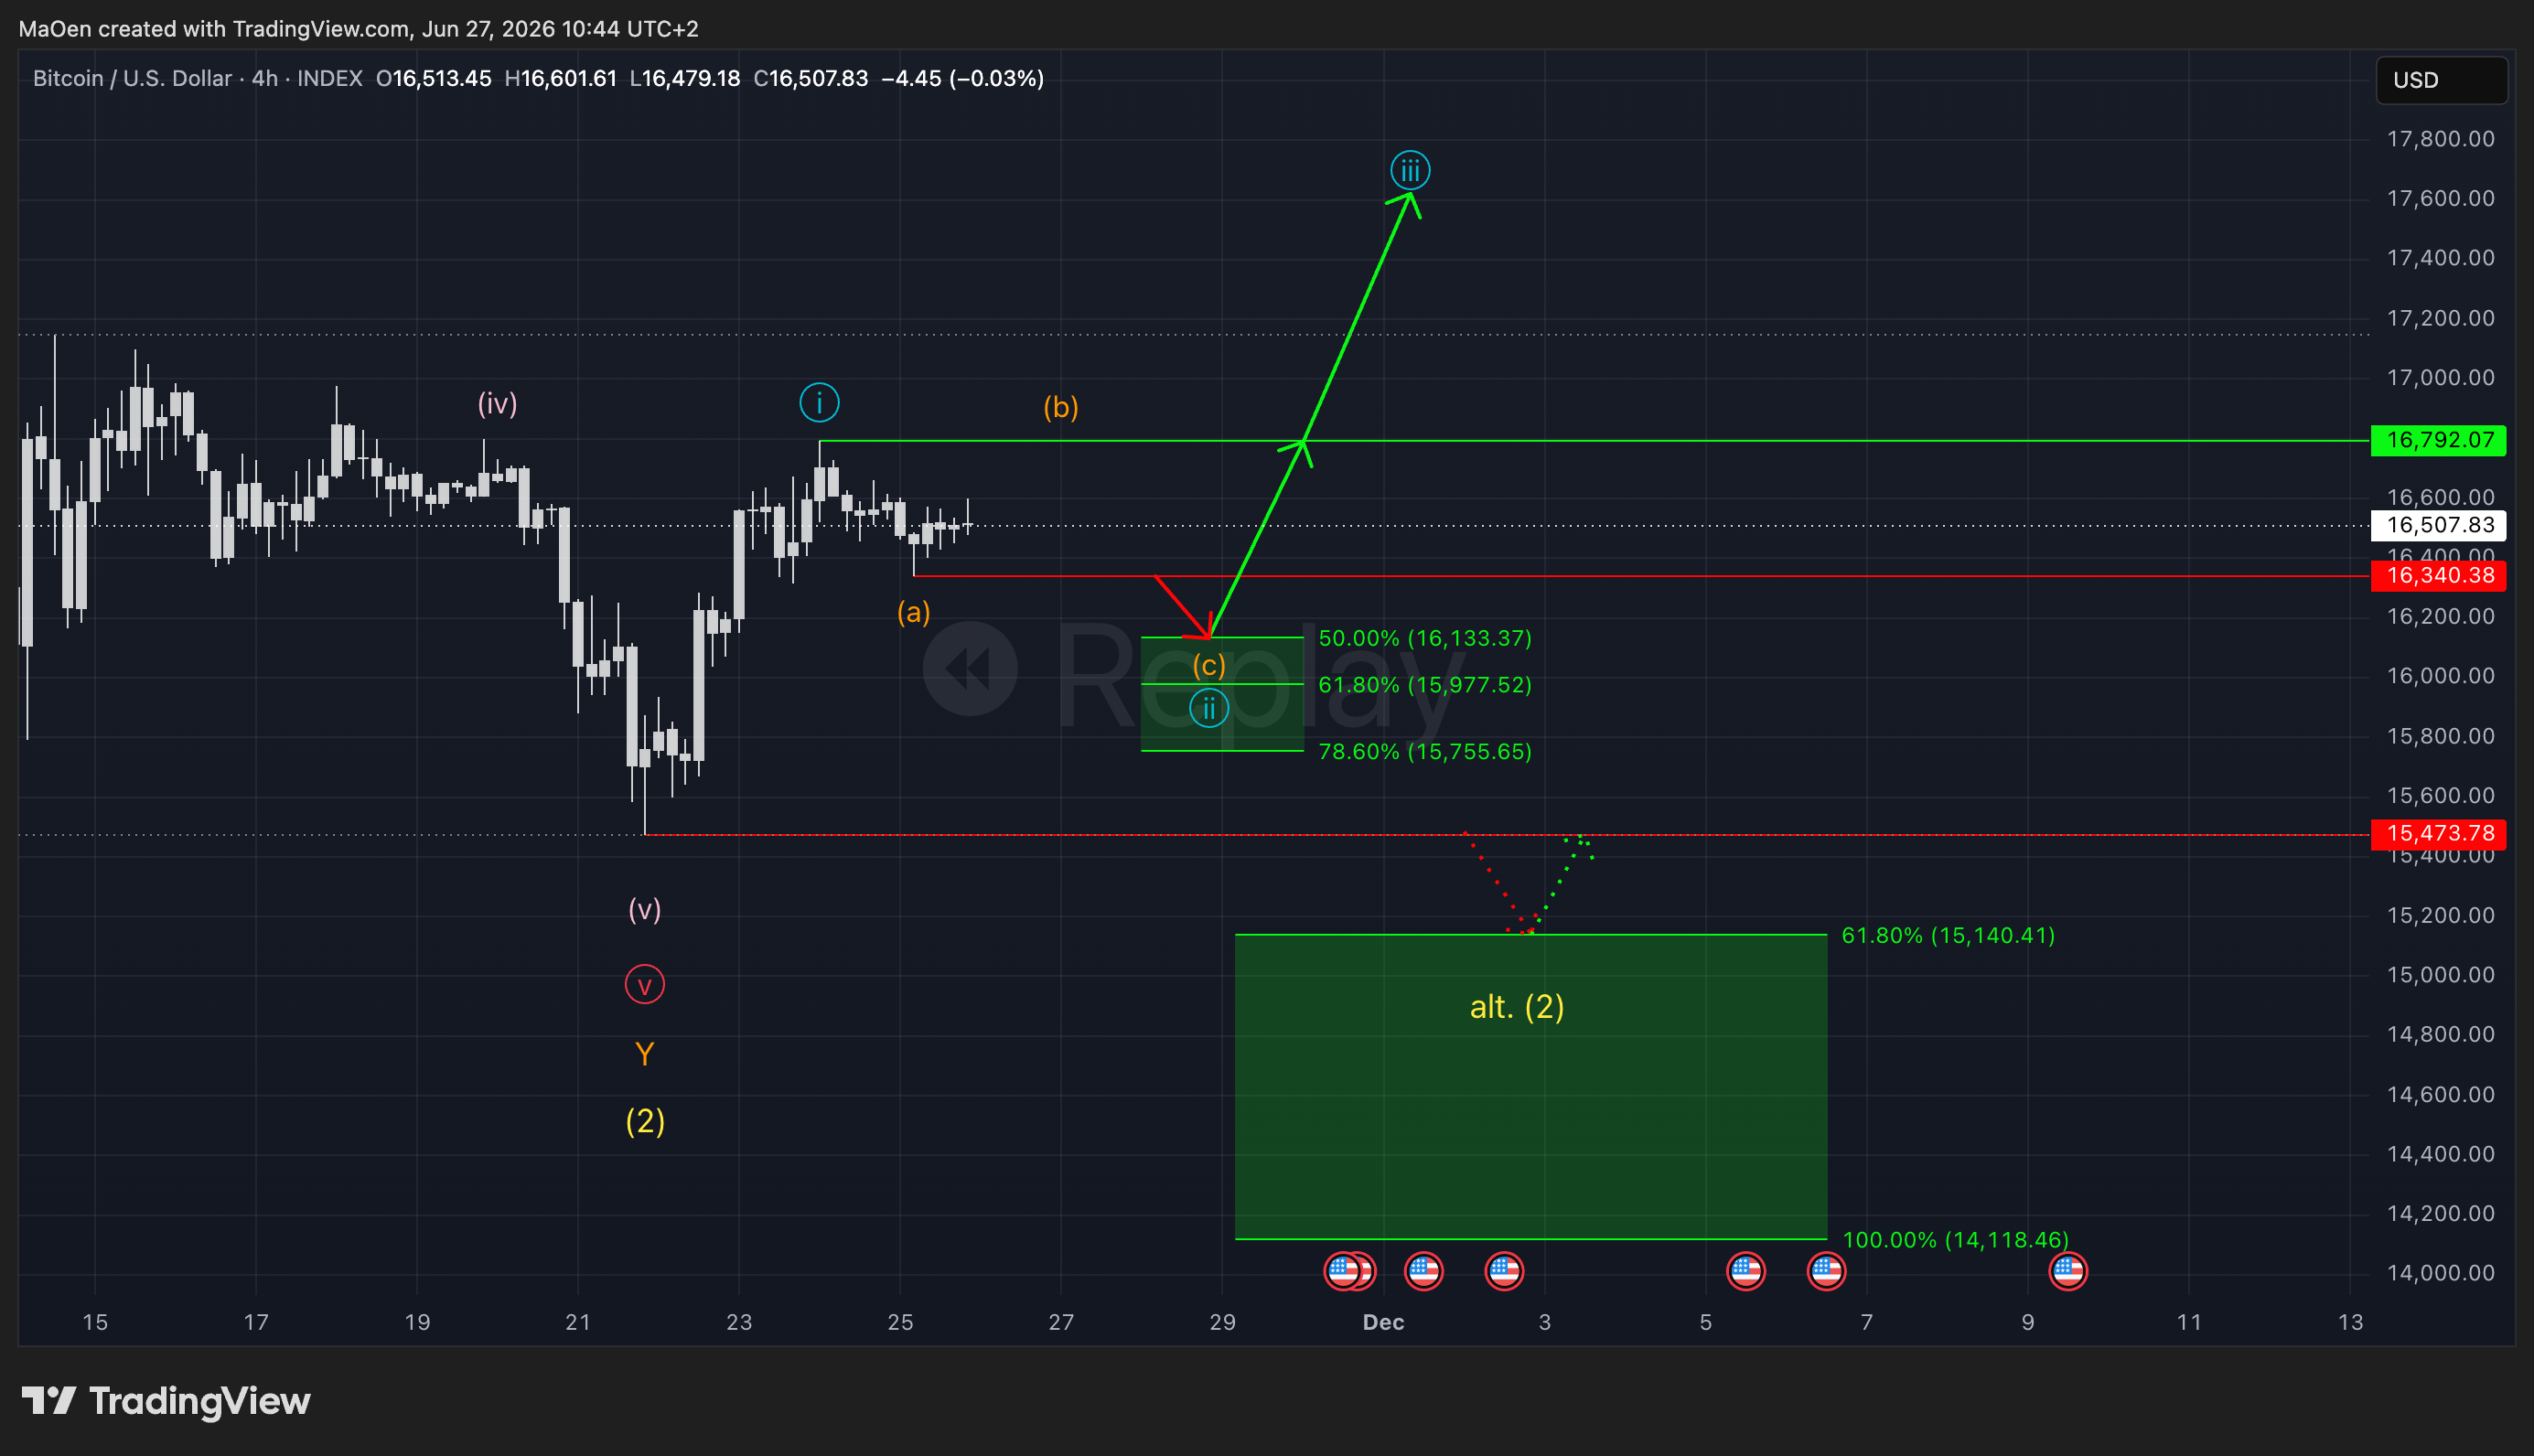
In the chart above, you can see our primary Fibonacci retracement zone drawn in green. With the creation of this zone, we expect that the market has officially completed its short impulsive movement — light blue wave 1 — and will now pull back into a short corrective phase to form light blue wave 2. The green zone marks exactly where we expect that correction to find support and for light blue wave 2 to be completed.
The Fibonacci levels are outlined as clear buying opportunities, as we expect the market, after the correction, to regain bullish momentum and rise far above the previous high of light blue wave 1 at $16,792.
Long entry levels:
- 50% at 16,133$
- 61.8% at 15,977$
- 78.6% at 15,755$
stop loss:
- 1% below zone at 15,598$
(We always set a stop loss at 1% below the zone to give the market a small buffer, as it can occasionally dip slightly below the zone. For traders actively trading these zones, using a stop loss should be an absolute rule. However, if you are investing long-term, a stop loss is not strictly necessary — in that case, you can use these zones more as accumulation areas to build a clean Dollar Cost Average (DCA) position.)
Once the zone is active, the market has reached very discounted price levels and is about to turn — as long as the primary scenario plays out as expected.
We try to always include an alternative scenario on the chart. This is not because we expect it to play out — it is there to keep our members prepared in case the market invalidates the primary count.
In the chart, you can see this alternative marked in yellow as "Alt. (2)". It represents the scenario where Bitcoin does not already reached its long-term bottom and breaks below the local bottom at $15,473 and drops to new lows, reaching the second Fibonacci zone. This gives us a second, lower entry opportunity if the primary zone fails.
Alternative Long entry positions:
- 61.8% at 15,140$
- 100% at 14,118$
Stop loss:
- 1% below zone at 13,975$
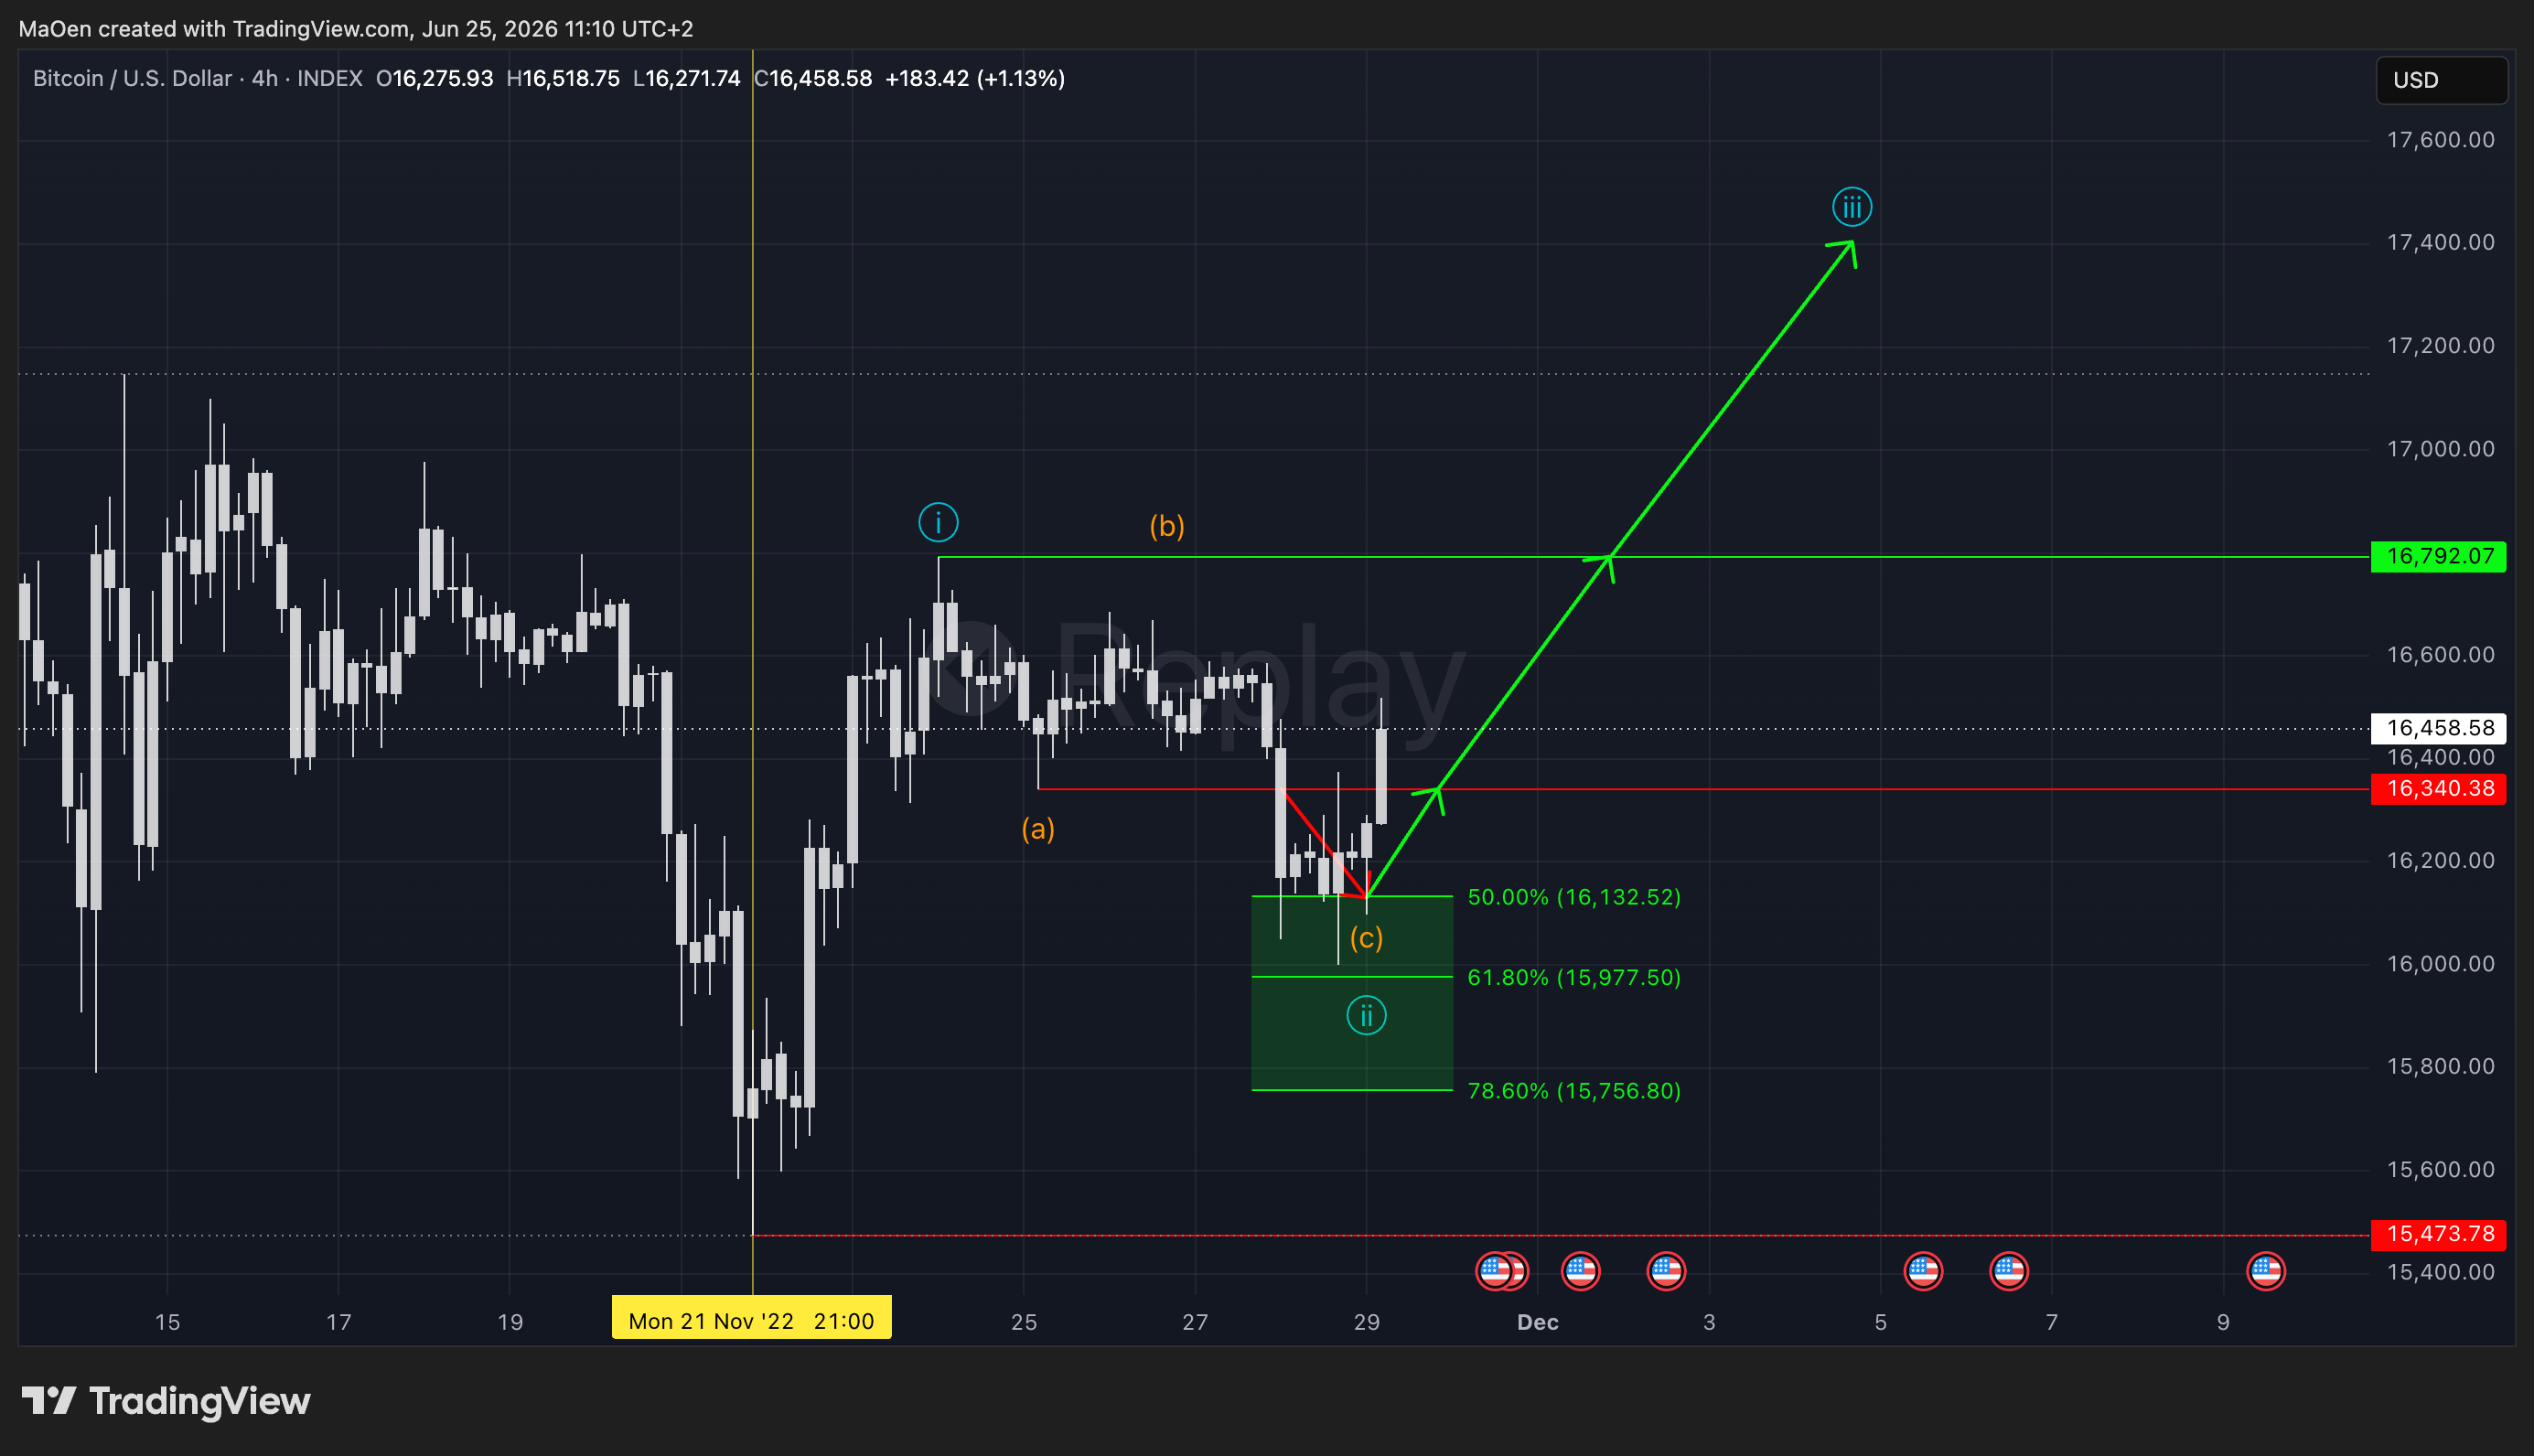
The market has now moved into our Fibonacci zone and activated it. In our live analysis at this point, we would update our members immediately as the zone is touched.
As you can see in the chart, the market reacted strongly in our zone and immediately pushed higher — exactly as expected.
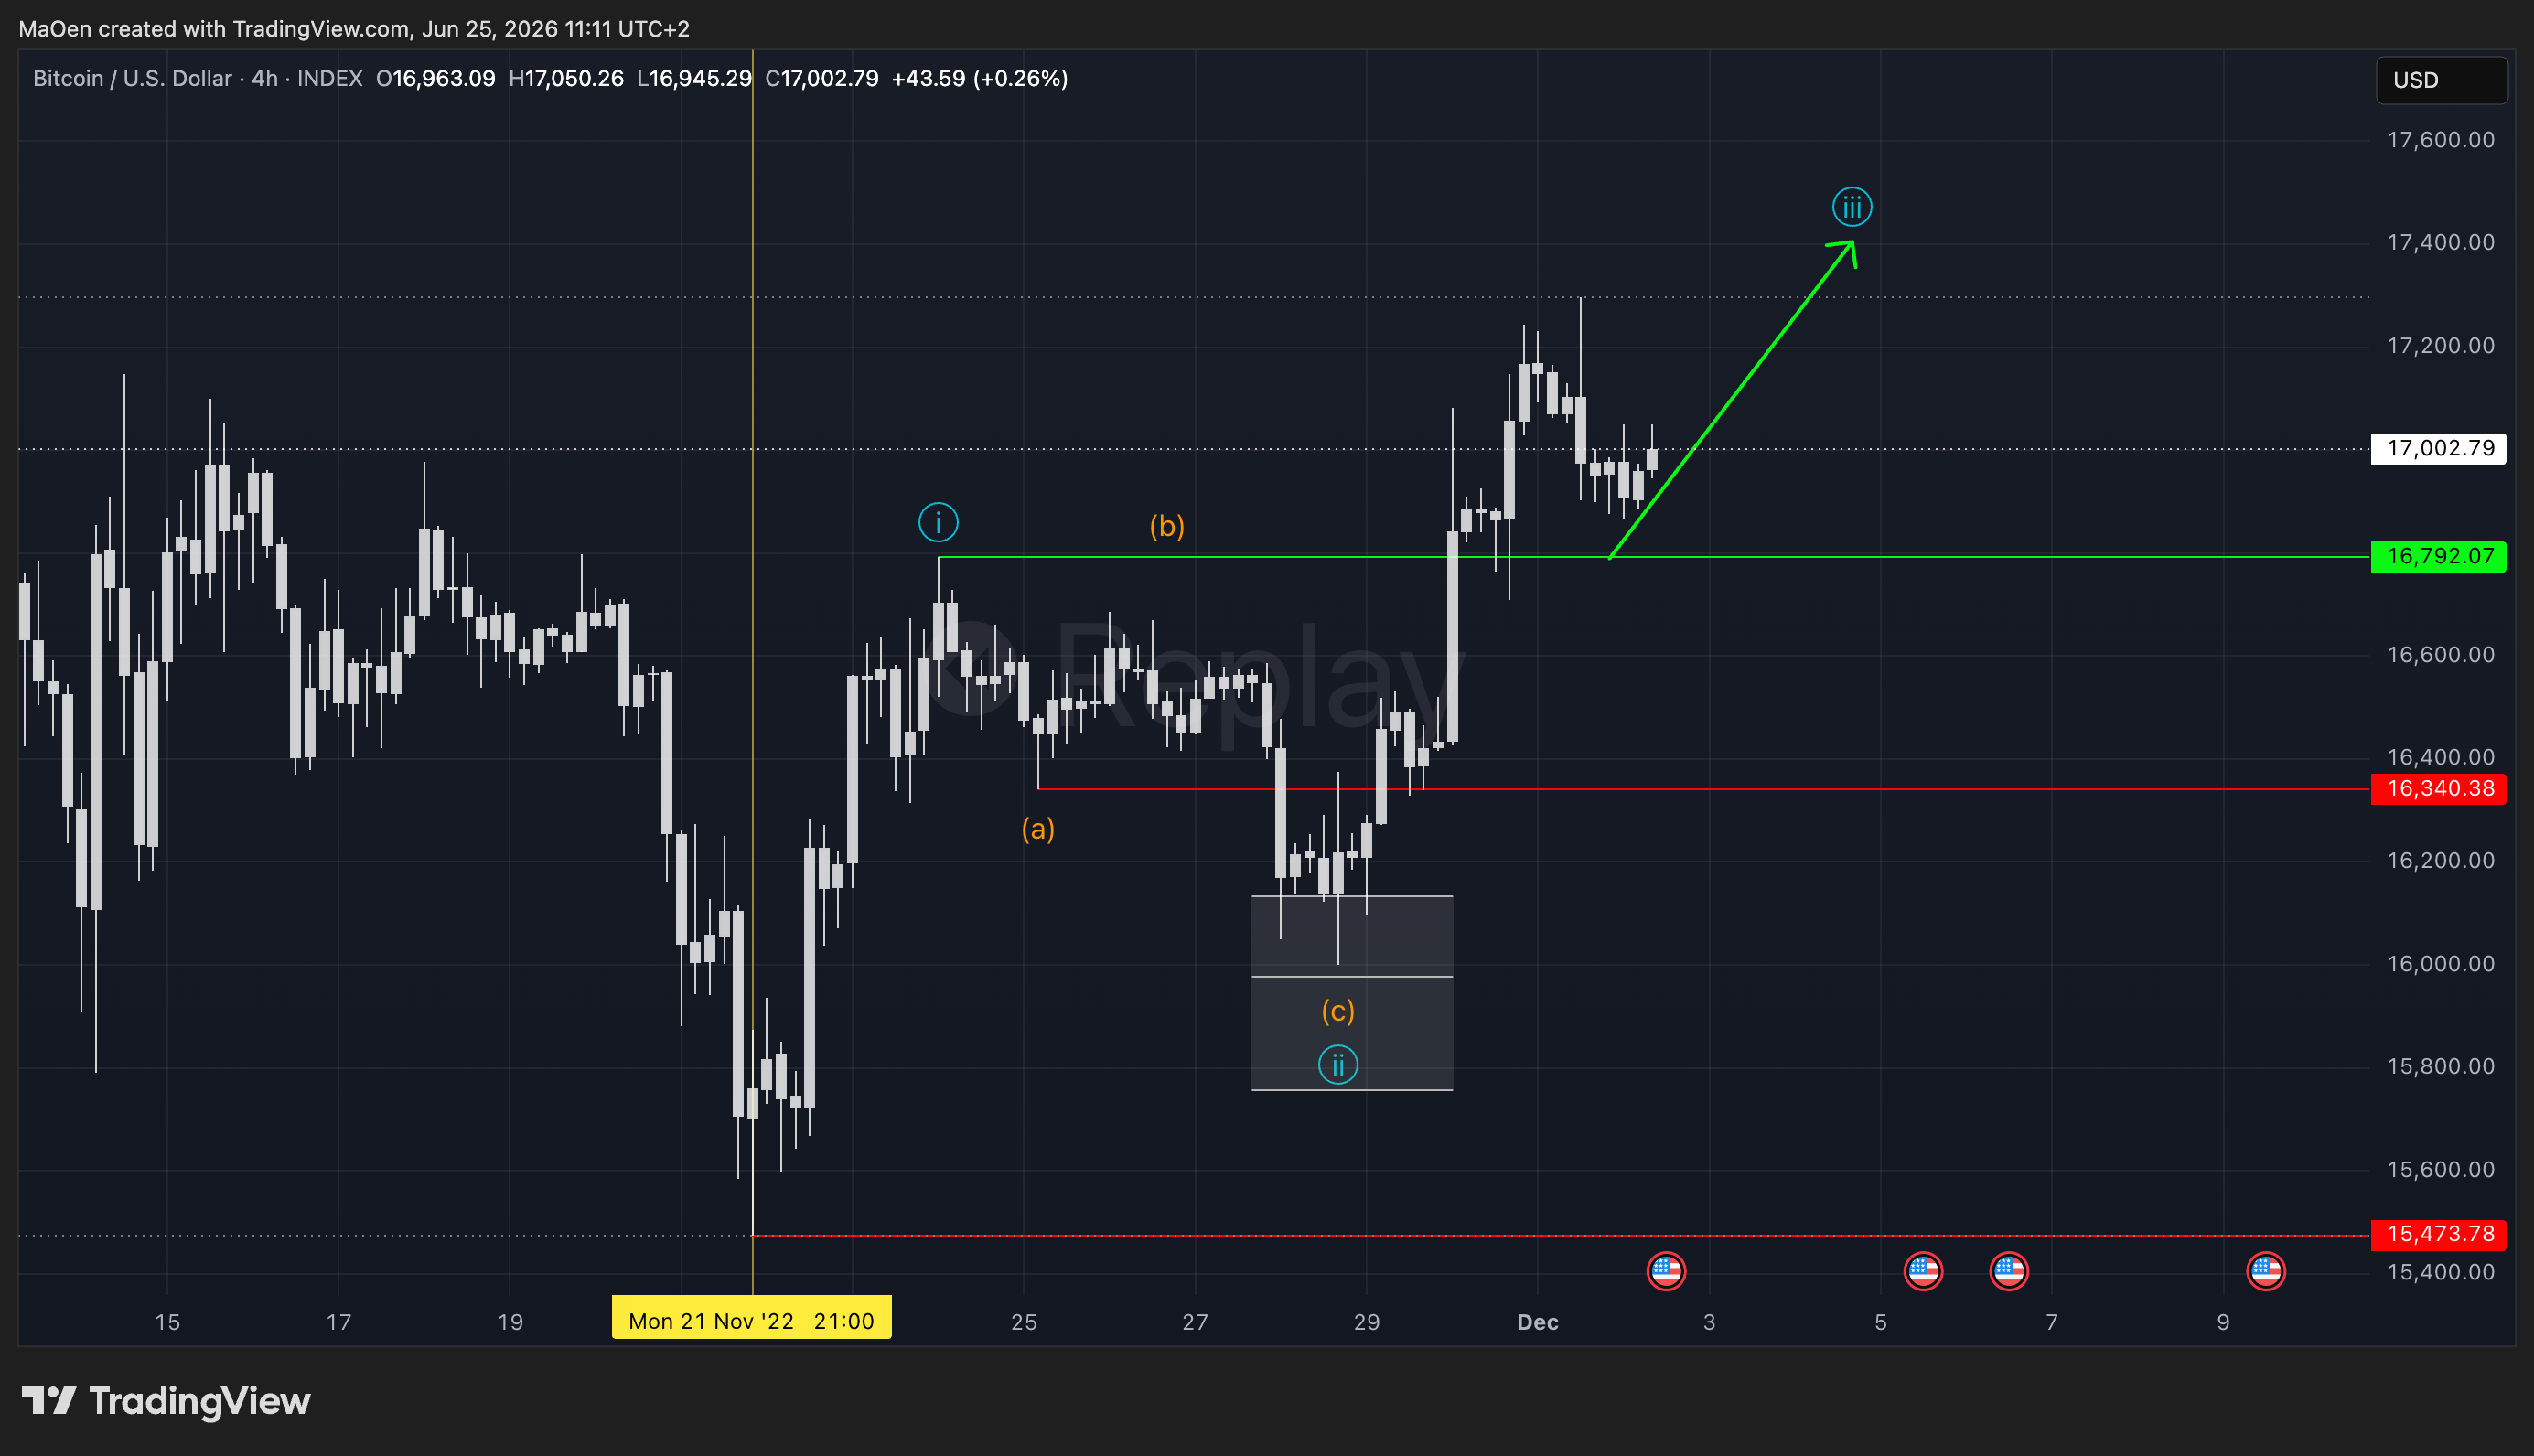
In the chart above, you can see the result: the market actively reached our Fibonacci retracement zone, triggered our buying orders, successfully built light blue wave 2, and then pushed above the high of light blue wave 1 at $16,792. With that confirmation, we can now officially deactivate the Fibonacci zone and grey it out. We also remove the alternative scenario from the chart — the market has confirmed the bottom is in, and the primary scenario seems to be valid.
We recommend that once a Fibonacci zone is officially deactivated, you manage your risk by moving the stop loss to your entry point or even slightly above it. This way, in the worst case, you exit the market at break even or even with a small profit.
(We only deactivate our Fibonacci zones if they were activated, hit, and then reacted as expected — either by reaching important price levels that validate our expectation, or if the market moves up to 10% from the upper edge of our Fibonacci zone.)
In this example the market pushed above the high of light blue wave 1 and therefore we are able to validate this zone with a successful hit.
From now on, we expect Bitcoin to build light blue wave 3, which is never the shortest wave in a normal five-wave sequence. However, this wave is expected to be counted in a 5-wave sub-sequence from a lower cycle. Therefore, the market first pushes above the previous high of wave 1 — in this case, light blue wave 1 — and does not create light blue wave 3 directly, but first builds up wave 1 from a lower degree.
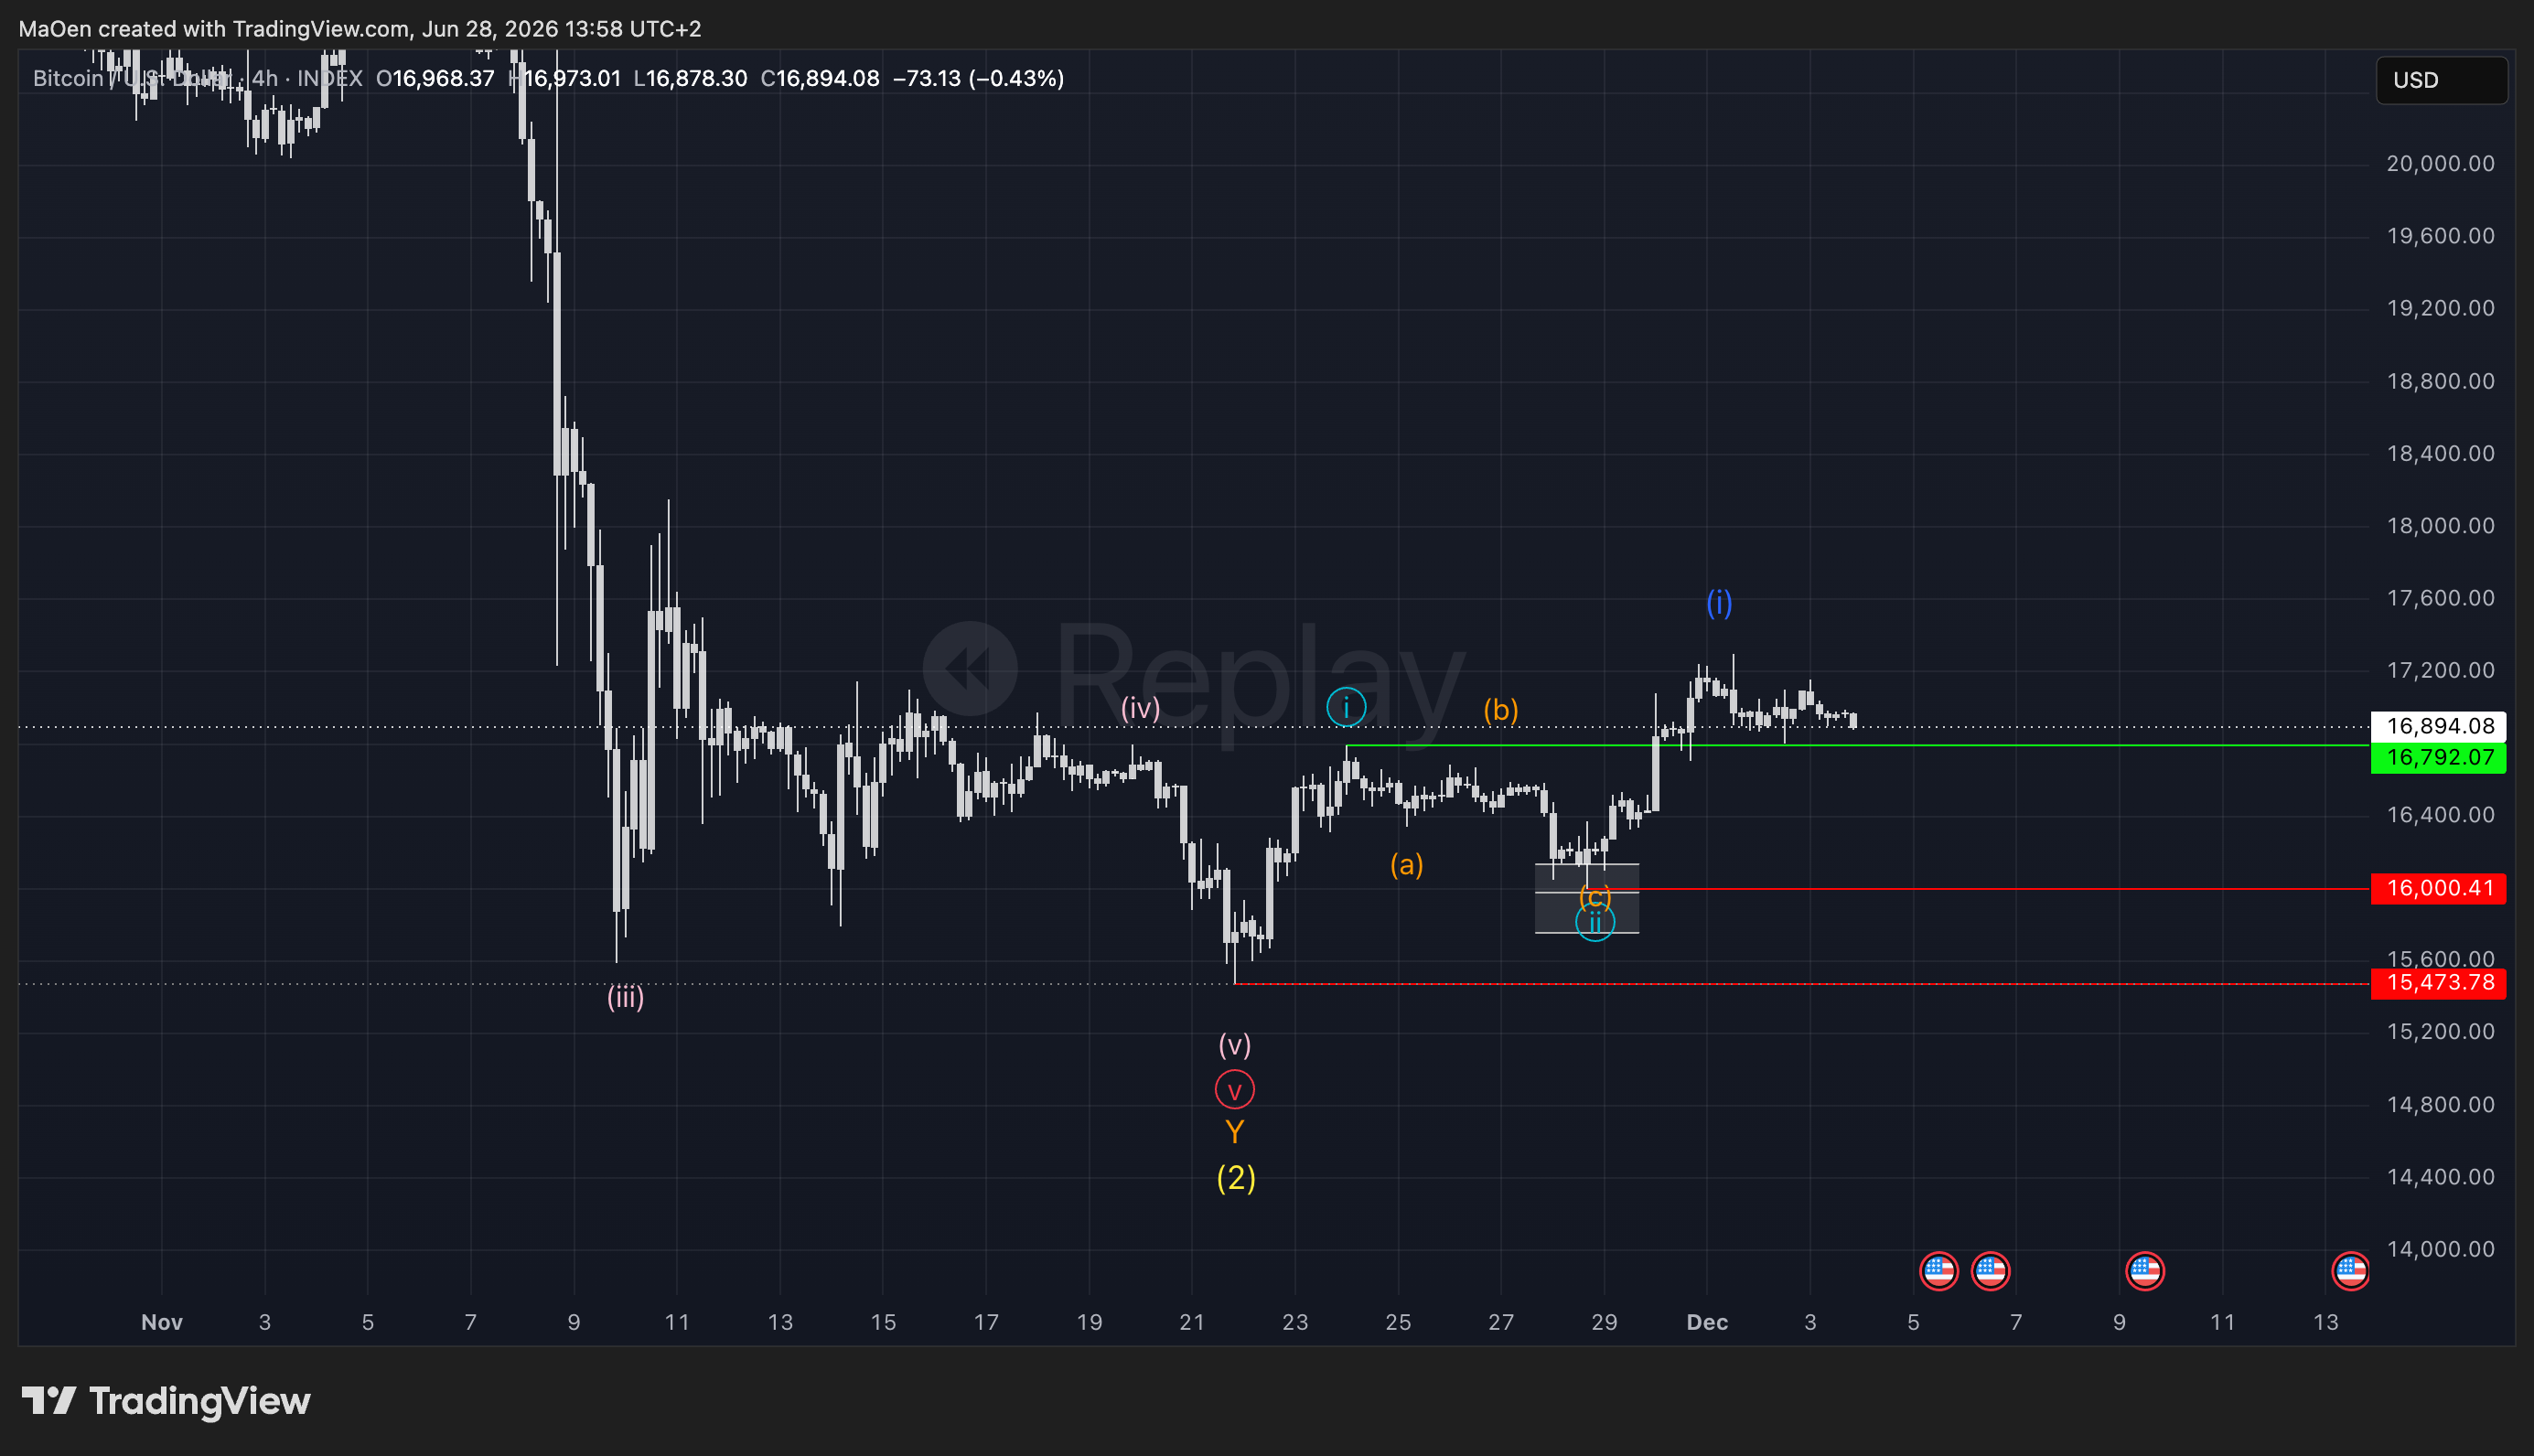
Important: we are now zooming into a lower degree cycle. This dark blue wave 1 is a sub-wave that sits inside the larger light blue wave 3. In other words, light blue wave 3 will be built by a full 5-wave sequence in dark blue — and we are currently at the start of that sequence. Since the market has just completed dark blue wave 1, we set another Fibonacci retracement zone to catch the short-term pullback into dark blue wave 2, which gives us a second buying opportunity at very fair prices.
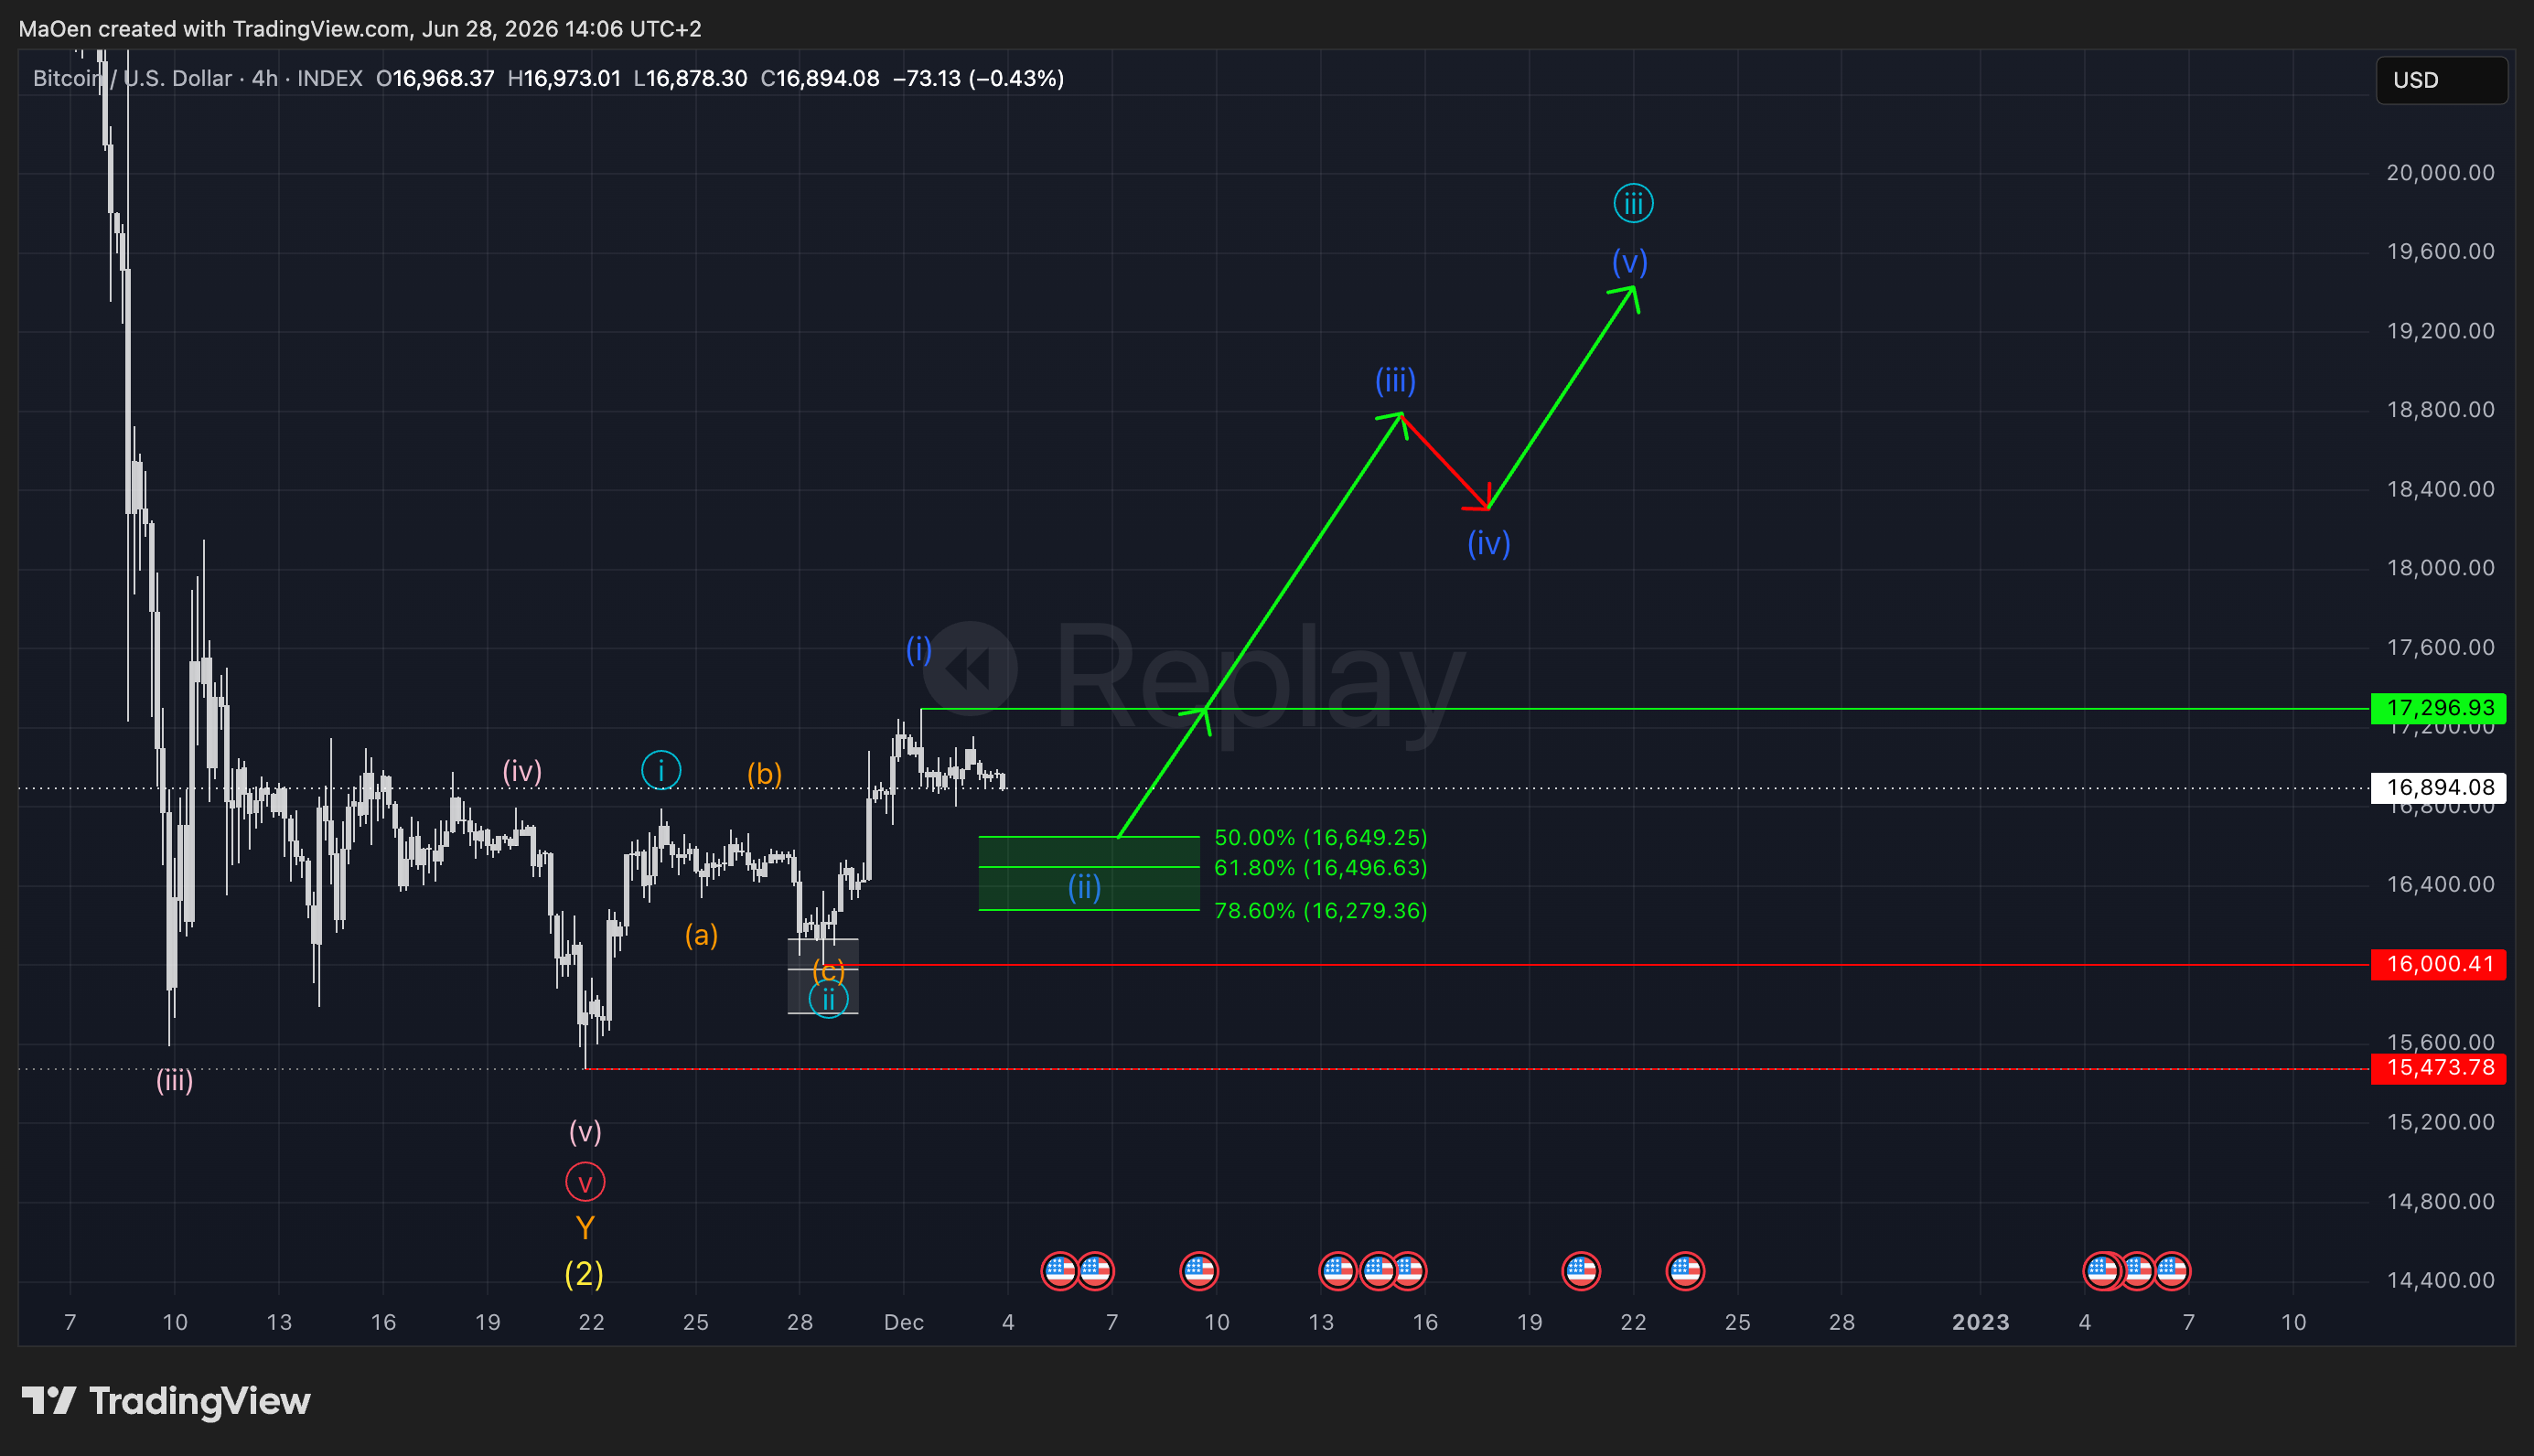
In the chart above you can see the zone is now drawn. The expectation is straightforward: the market pulls back into the zone (dark blue wave 2), activates it, and then pushes up to form dark blue waves 3, 4, and 5 — which together complete the overlying light blue wave 3.
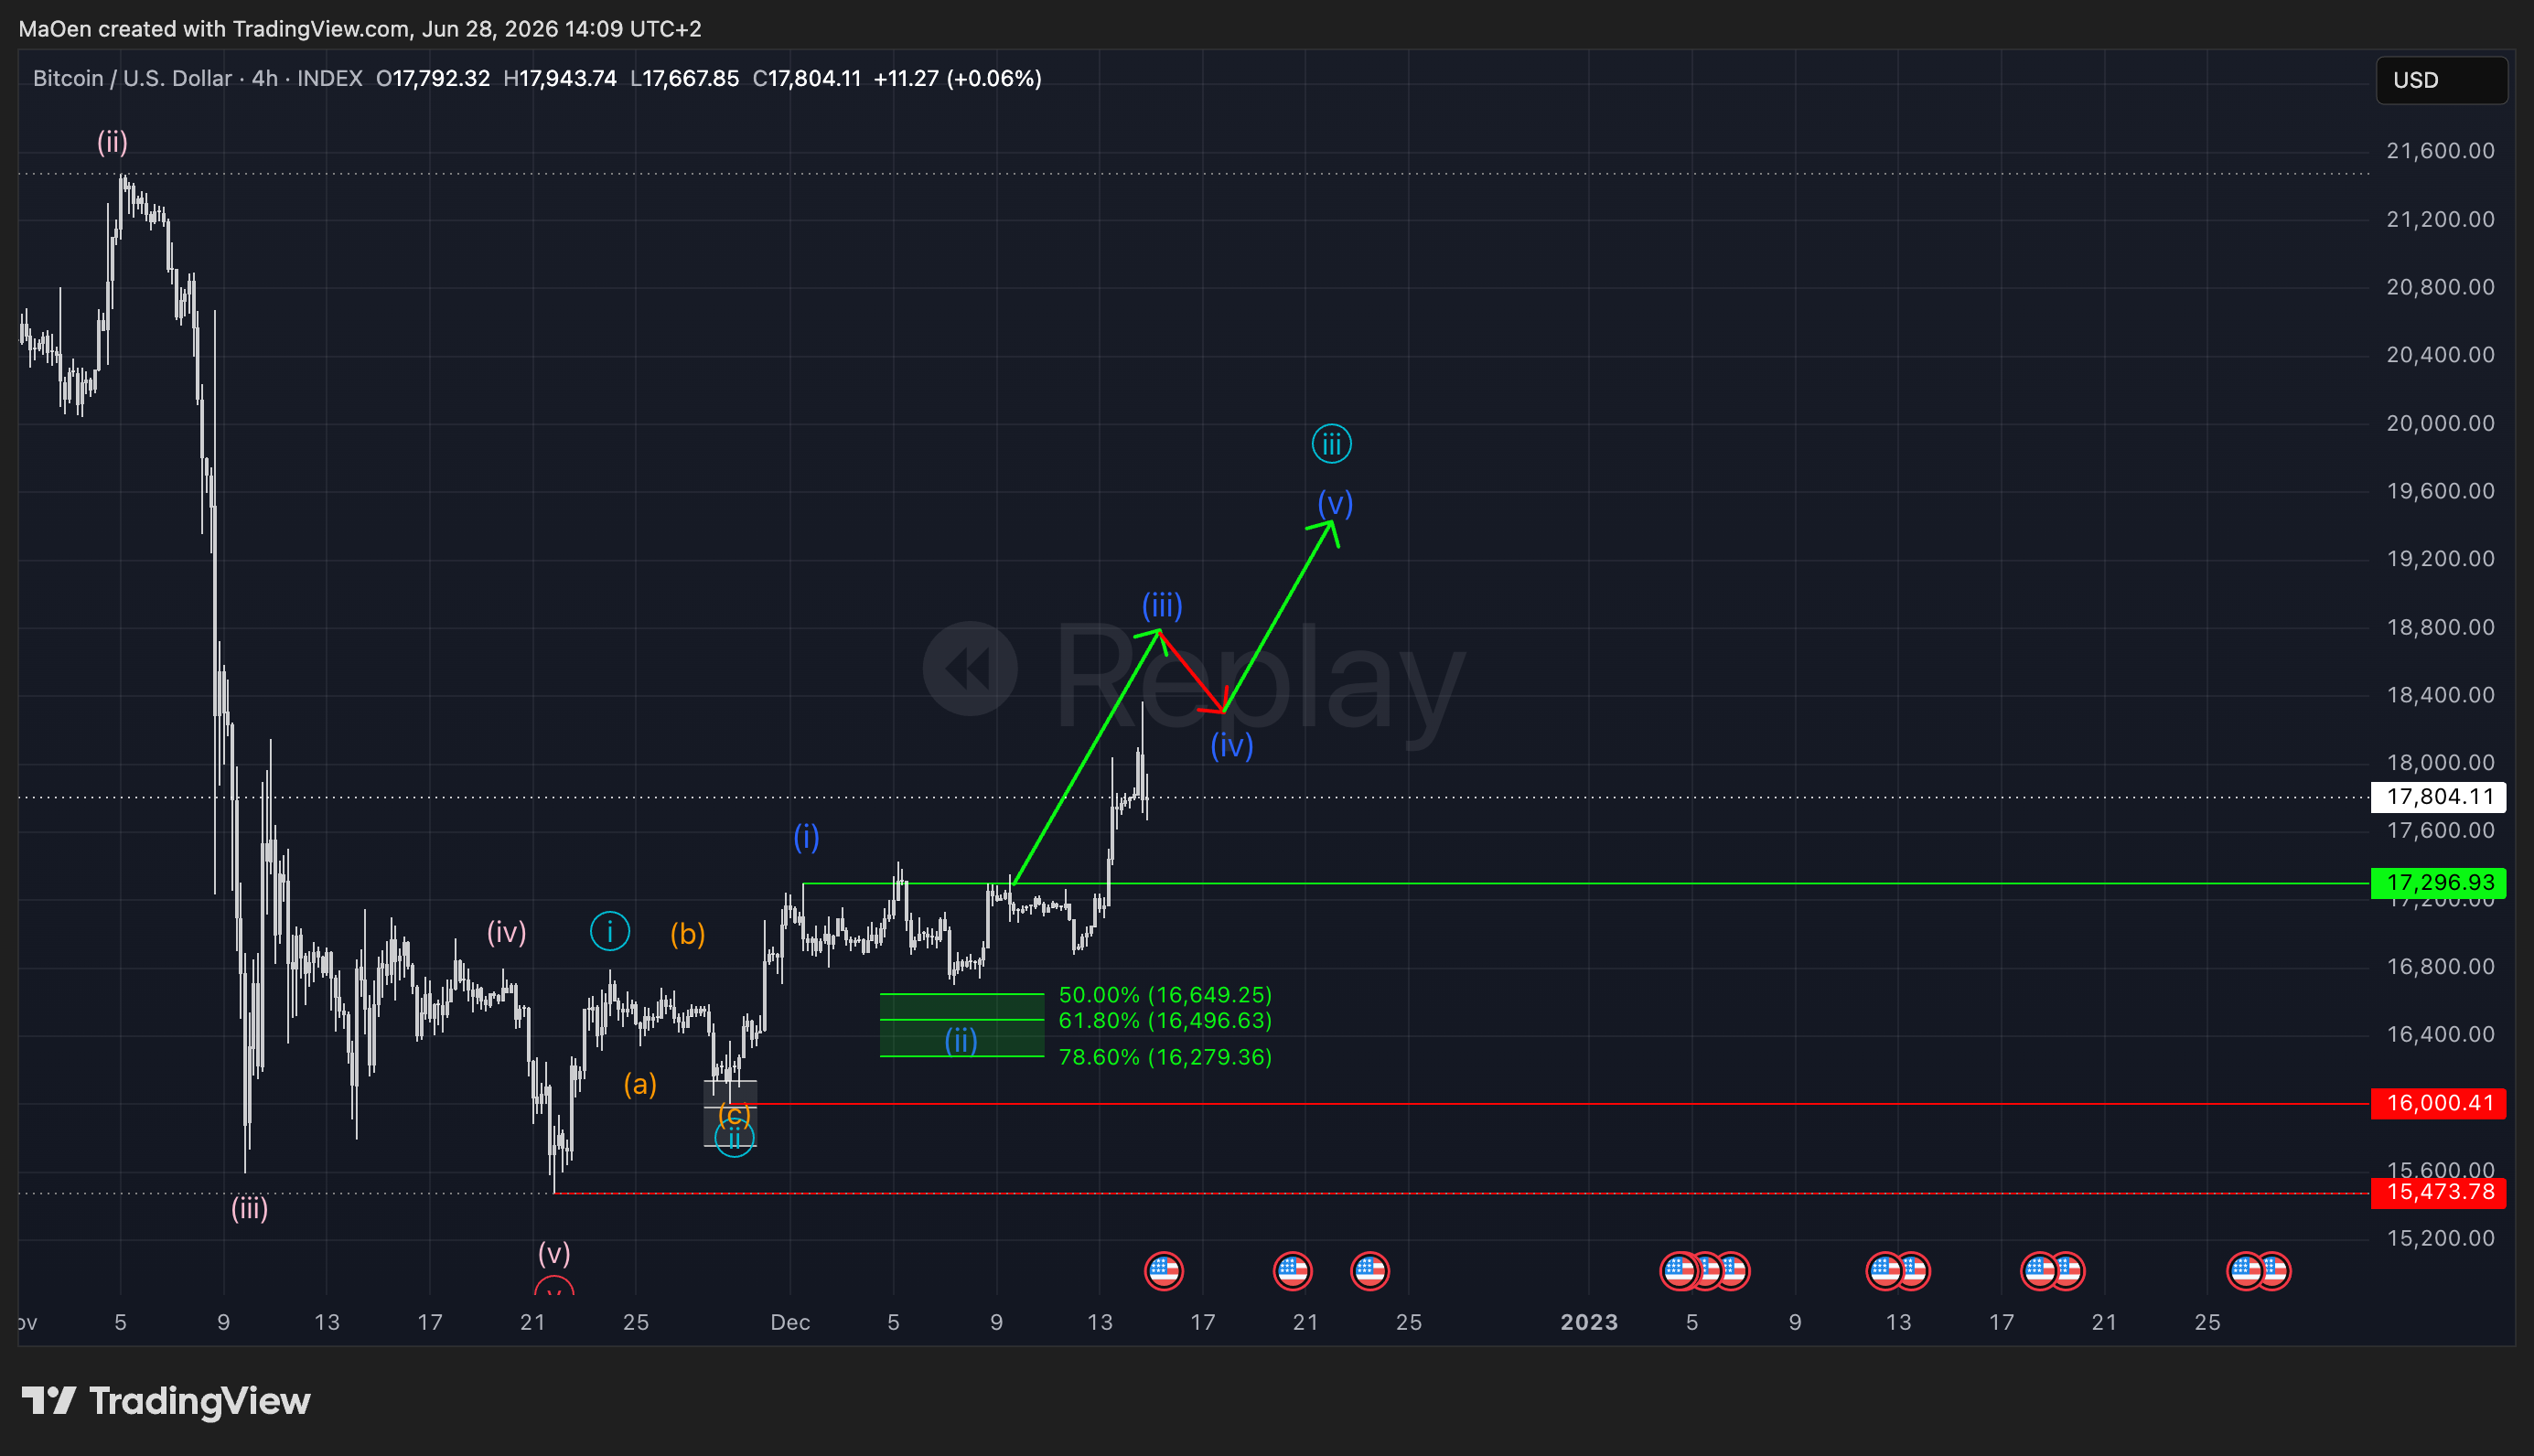
Within the next few trading hours, Bitcoin moved towards our previously set Fibonacci retracement zone but did not activate it. We did not buy again. However, the market moved up as expected. If the market does not activate our Fibonacci zone, we simply delete it and look for new entry opportunities. This is not a failed analysis — it only represents a strong, impulsive market movement. There is now a lot of room to interpret this market: either Bitcoin gained enough momentum to push and complete dark blue wave 3, following the structure toward light blue wave 3, or the market loses its grip and hits our Fibonacci zone at a later point in time.
In the chart below, you can see what this scenario looks like. The zone is still active, and we maintain the alternative scenario on the chart as well.
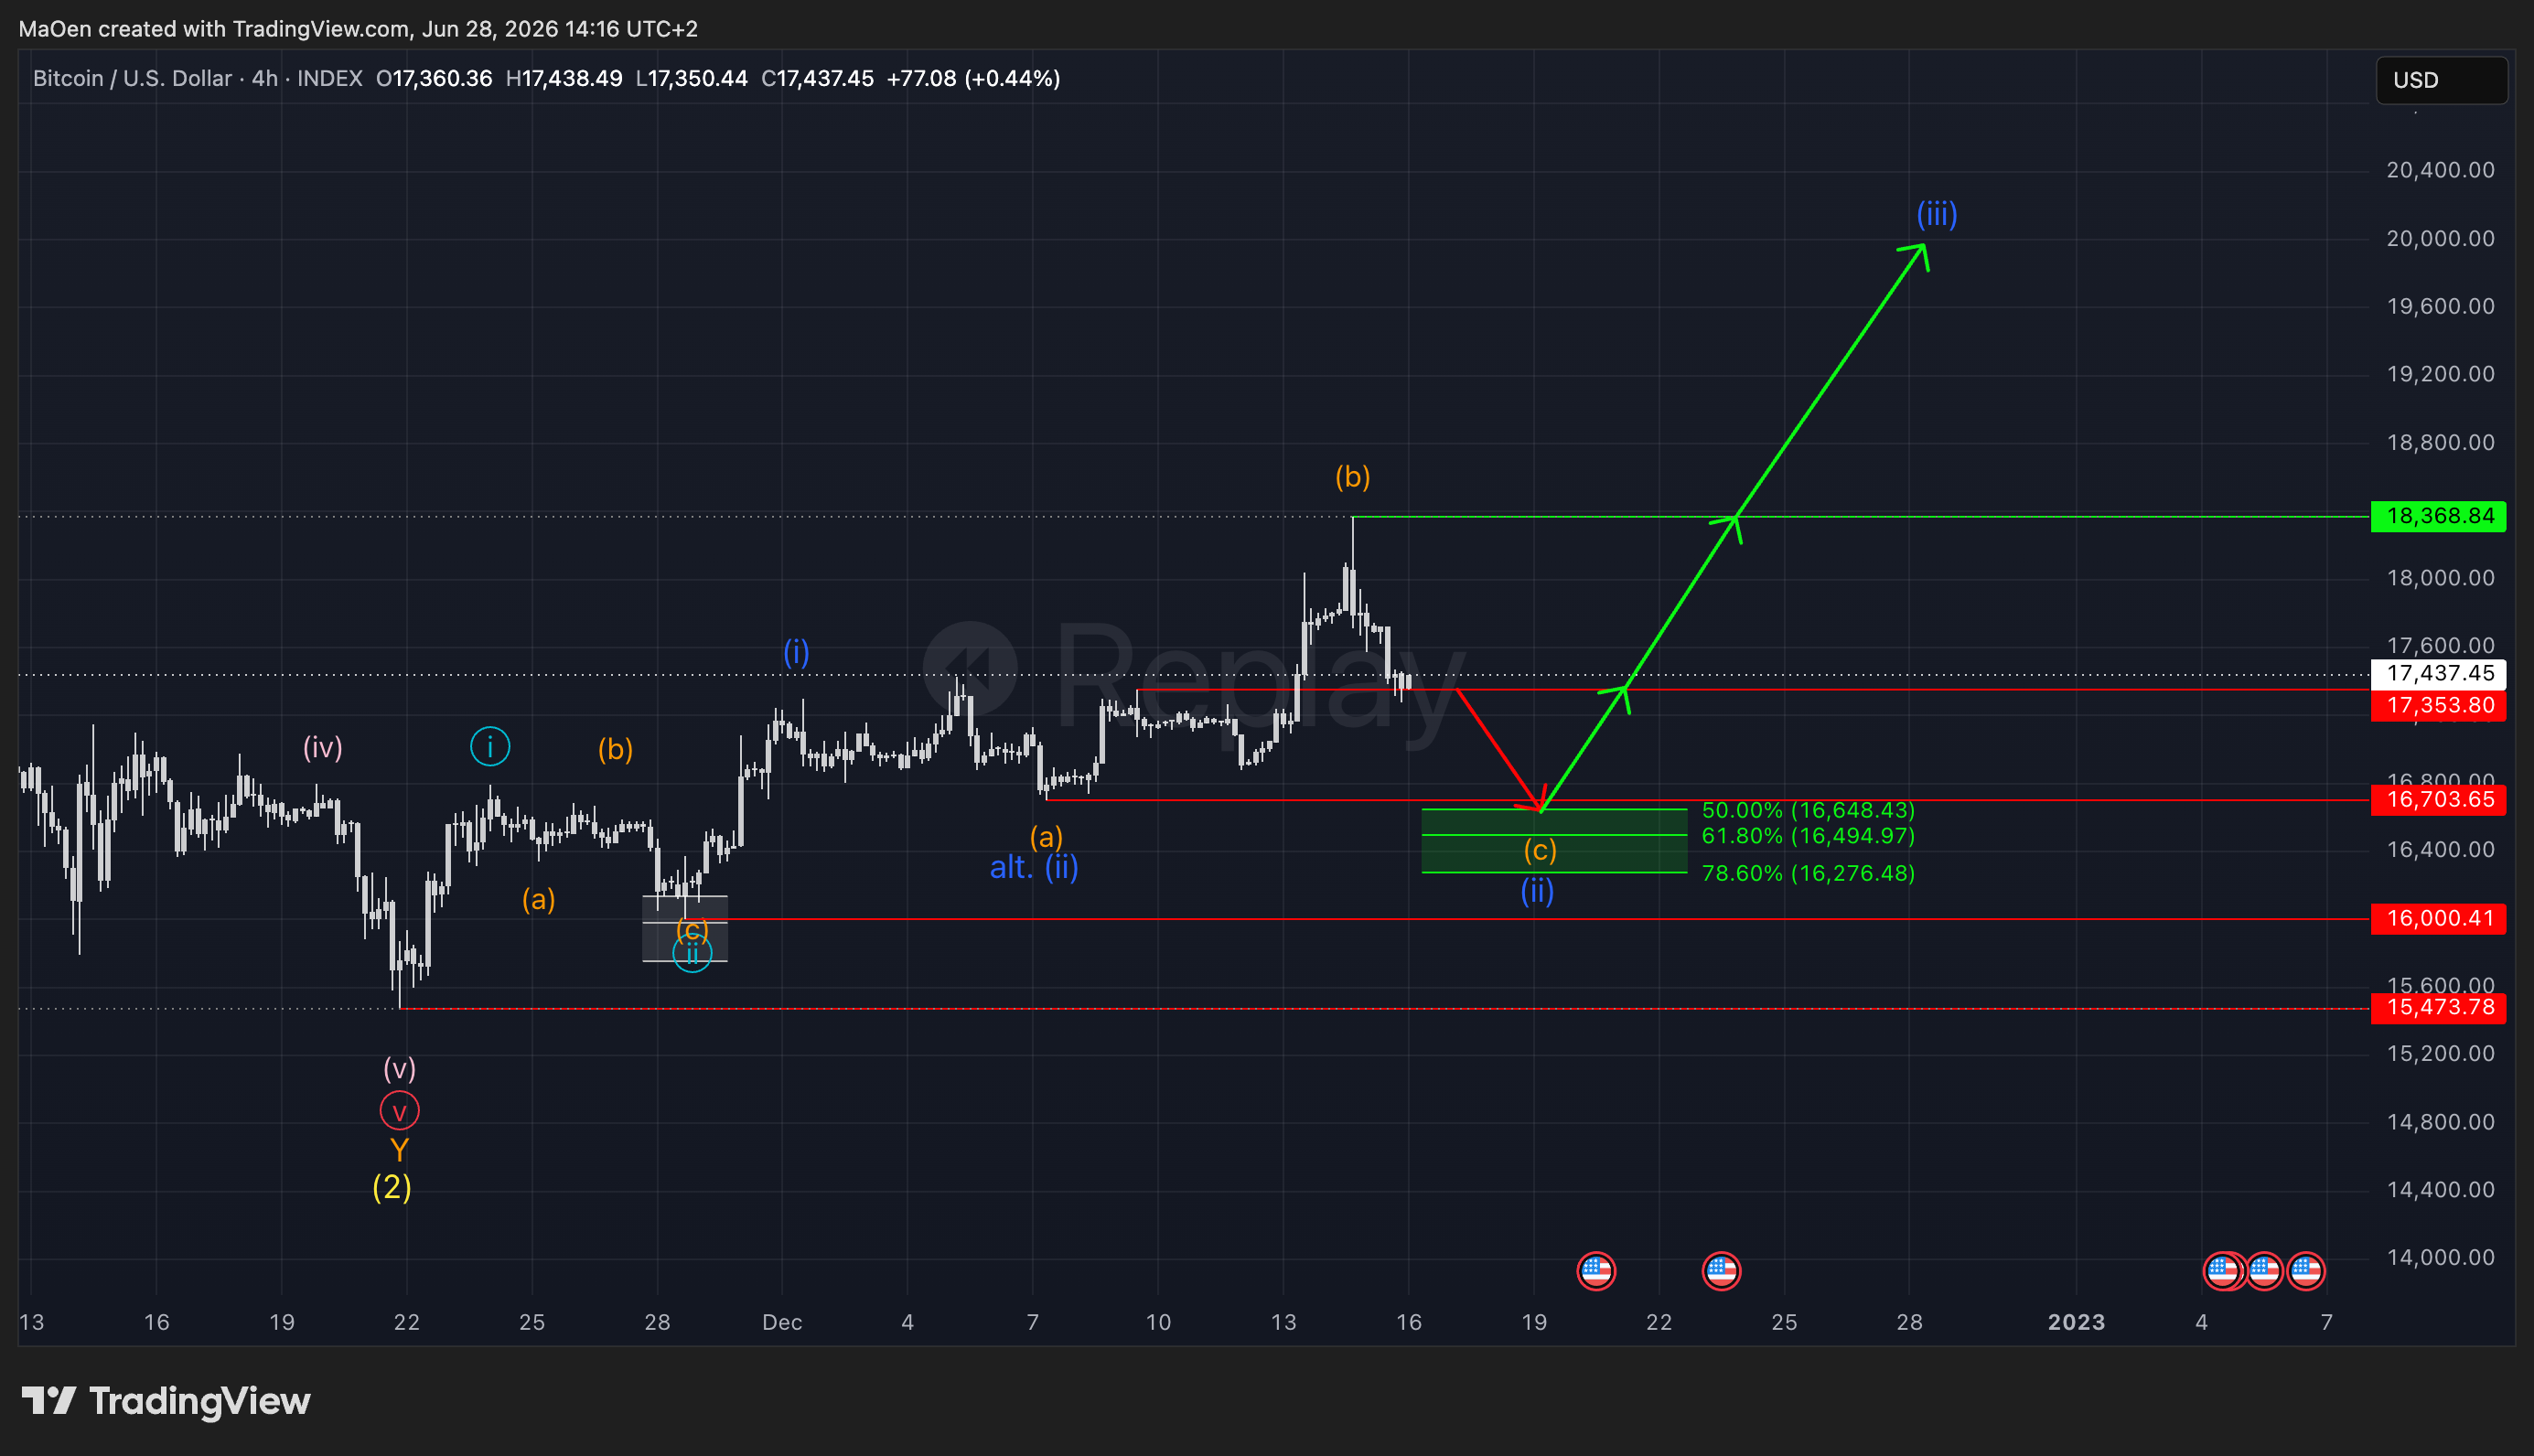
We would now expect that after the market fell back into the range of dark blue wave 1, it could still come back down and activate our Fibonacci retracement zone. The breakout above the previous dark blue wave 1 high is then interpreted as a corrective movement — an overshooting wave b. This wave is known for a fake out and tricks many traders into buying when it breaks out above certain levels with fast momentum. However, this momentum comes quickly and fades just as fast, leading to an overshooting wave b followed by a significant breakdown in the market, shaking many people out of their positions. In this case, we still expect the market to reach our Fibonacci zone and do not yet consider that the market has already created dark blue wave 2. That said, this possibility cannot be ruled out, so we again leave an alternative on the chart, marked as "alt.(ii)" in dark blue.
Long entry levels:
- 50% at 16,648$
- 61.8% at 16,494$
- 78.6% at 16,276$
stop loss:
- 1% below zone at 16,114$
The levels and entry points are clearly set.
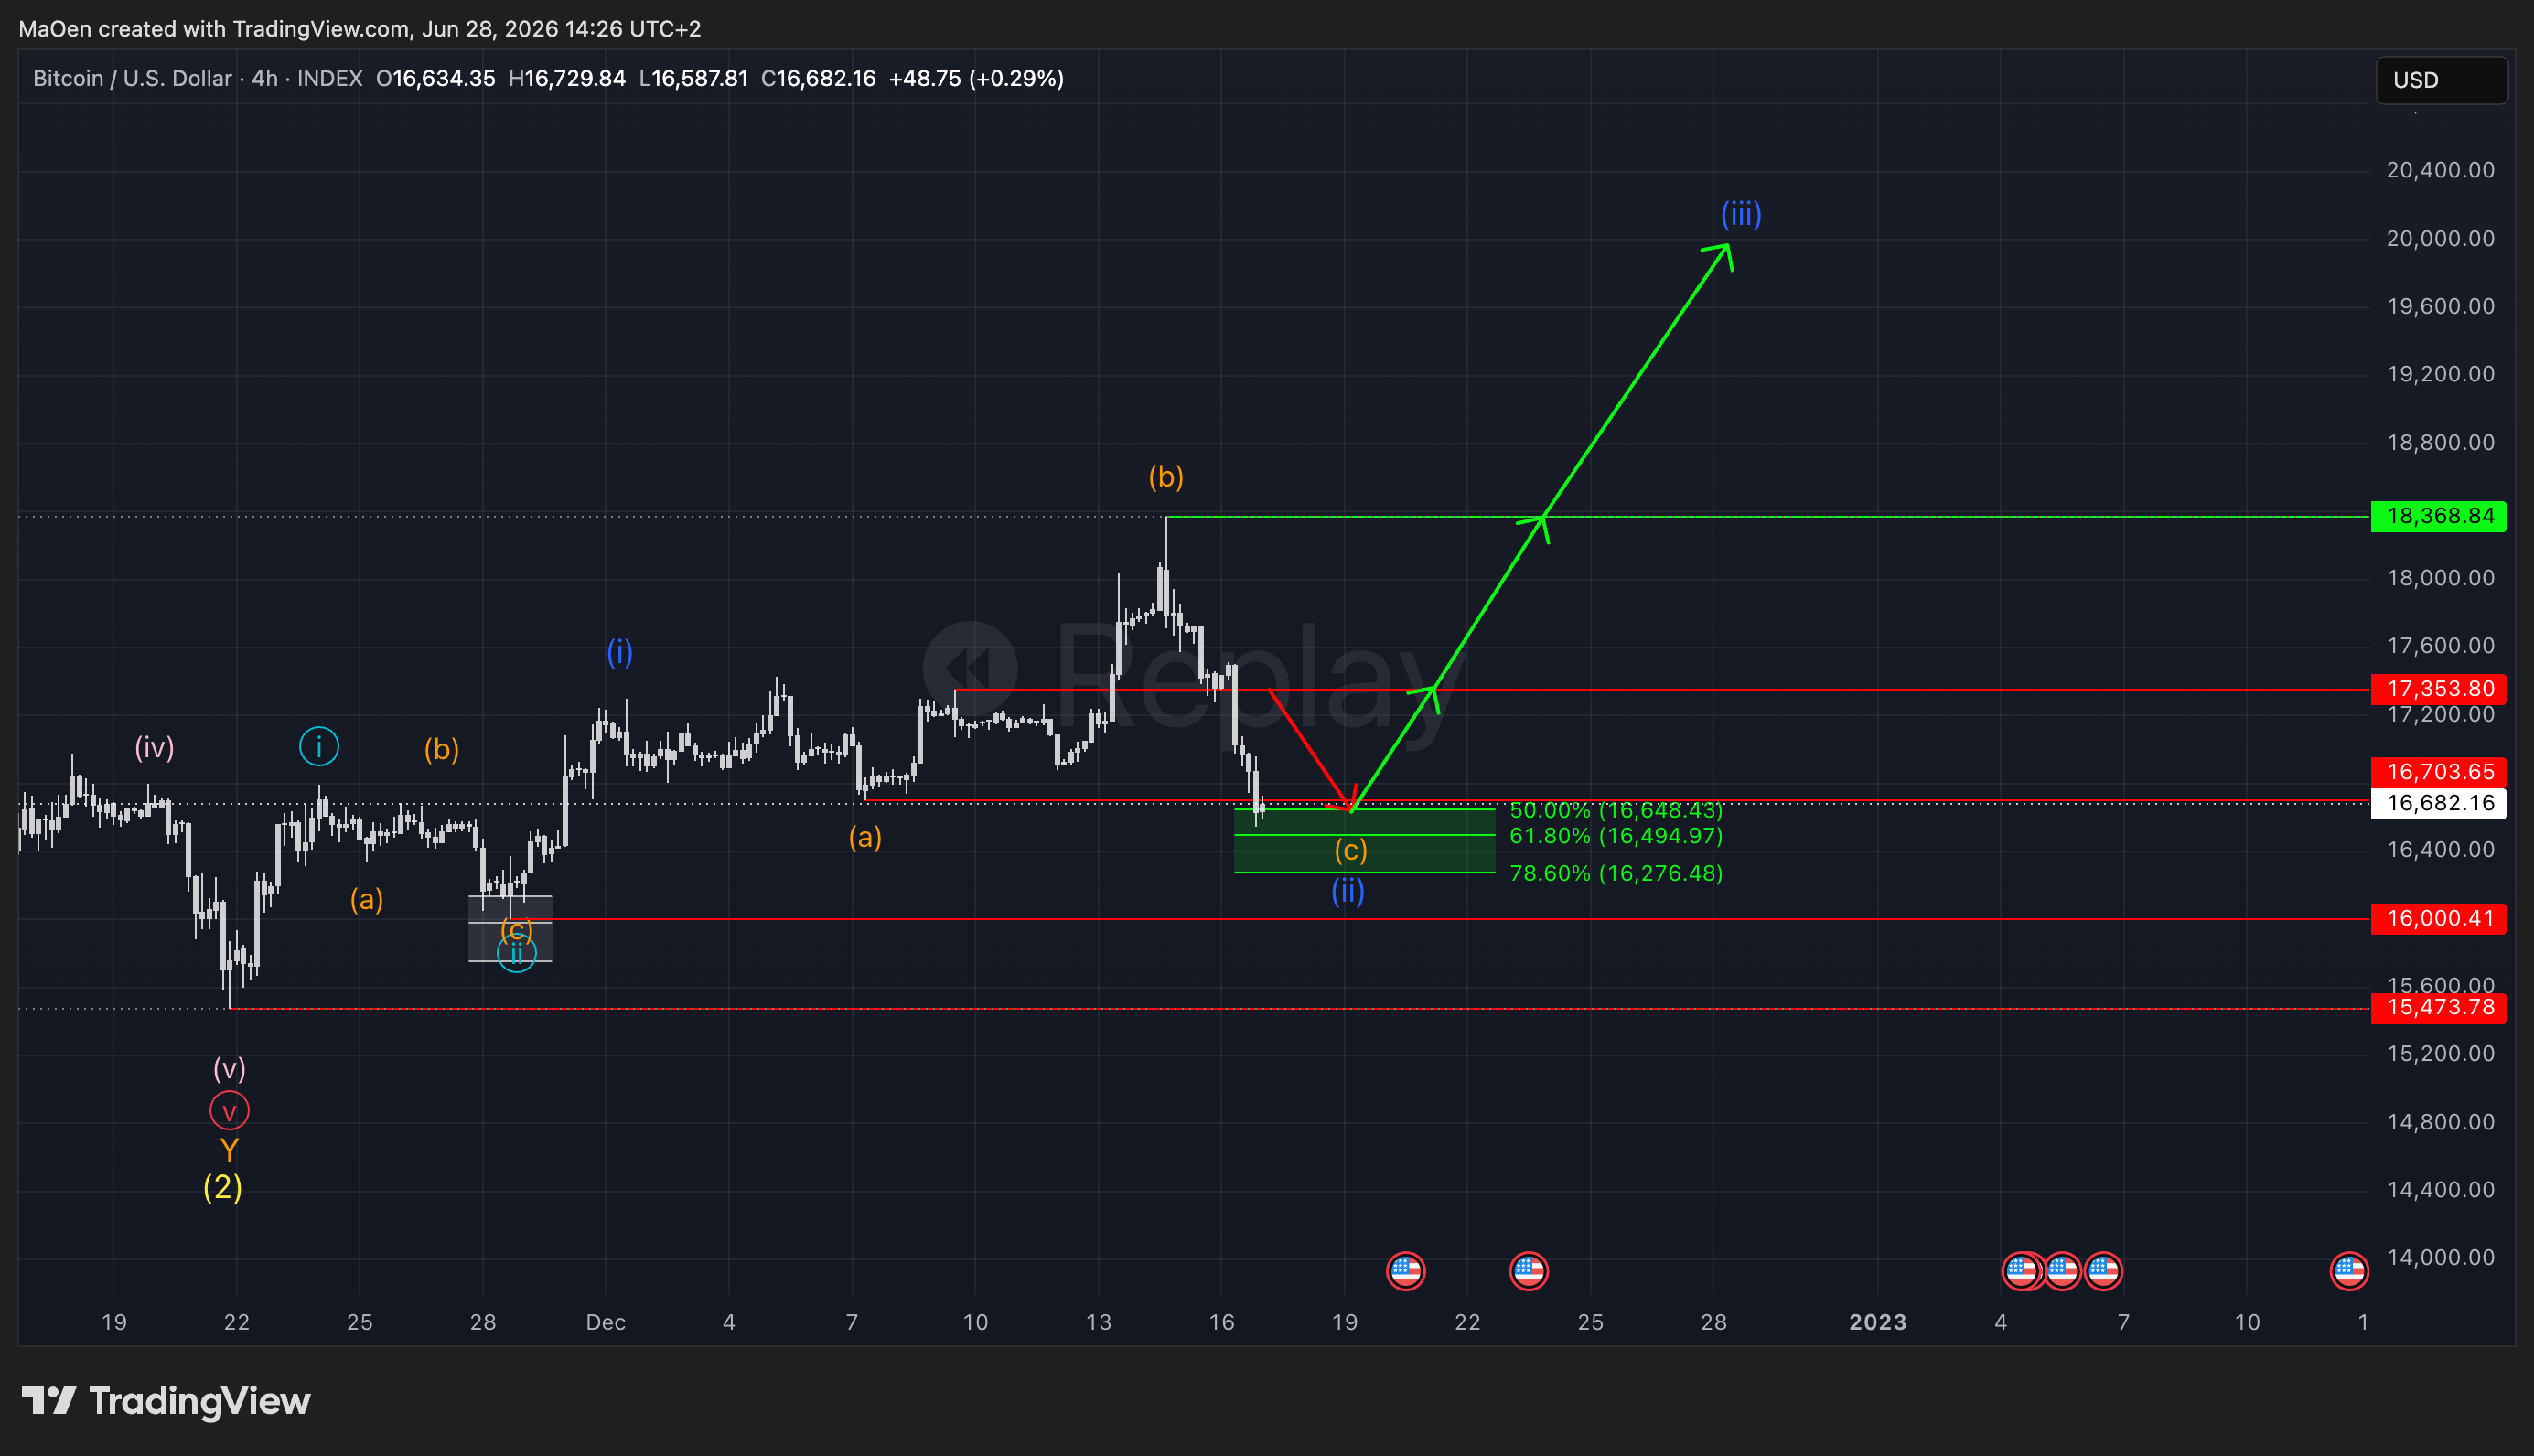
In the chart above, you can see the second zone is drawn and the market is approaching it. The zone has now been reached and activated, triggering our buying orders. We now expect the market to end the corrective phase, create dark blue wave 2, and push back up to build the overlying light blue wave 3.
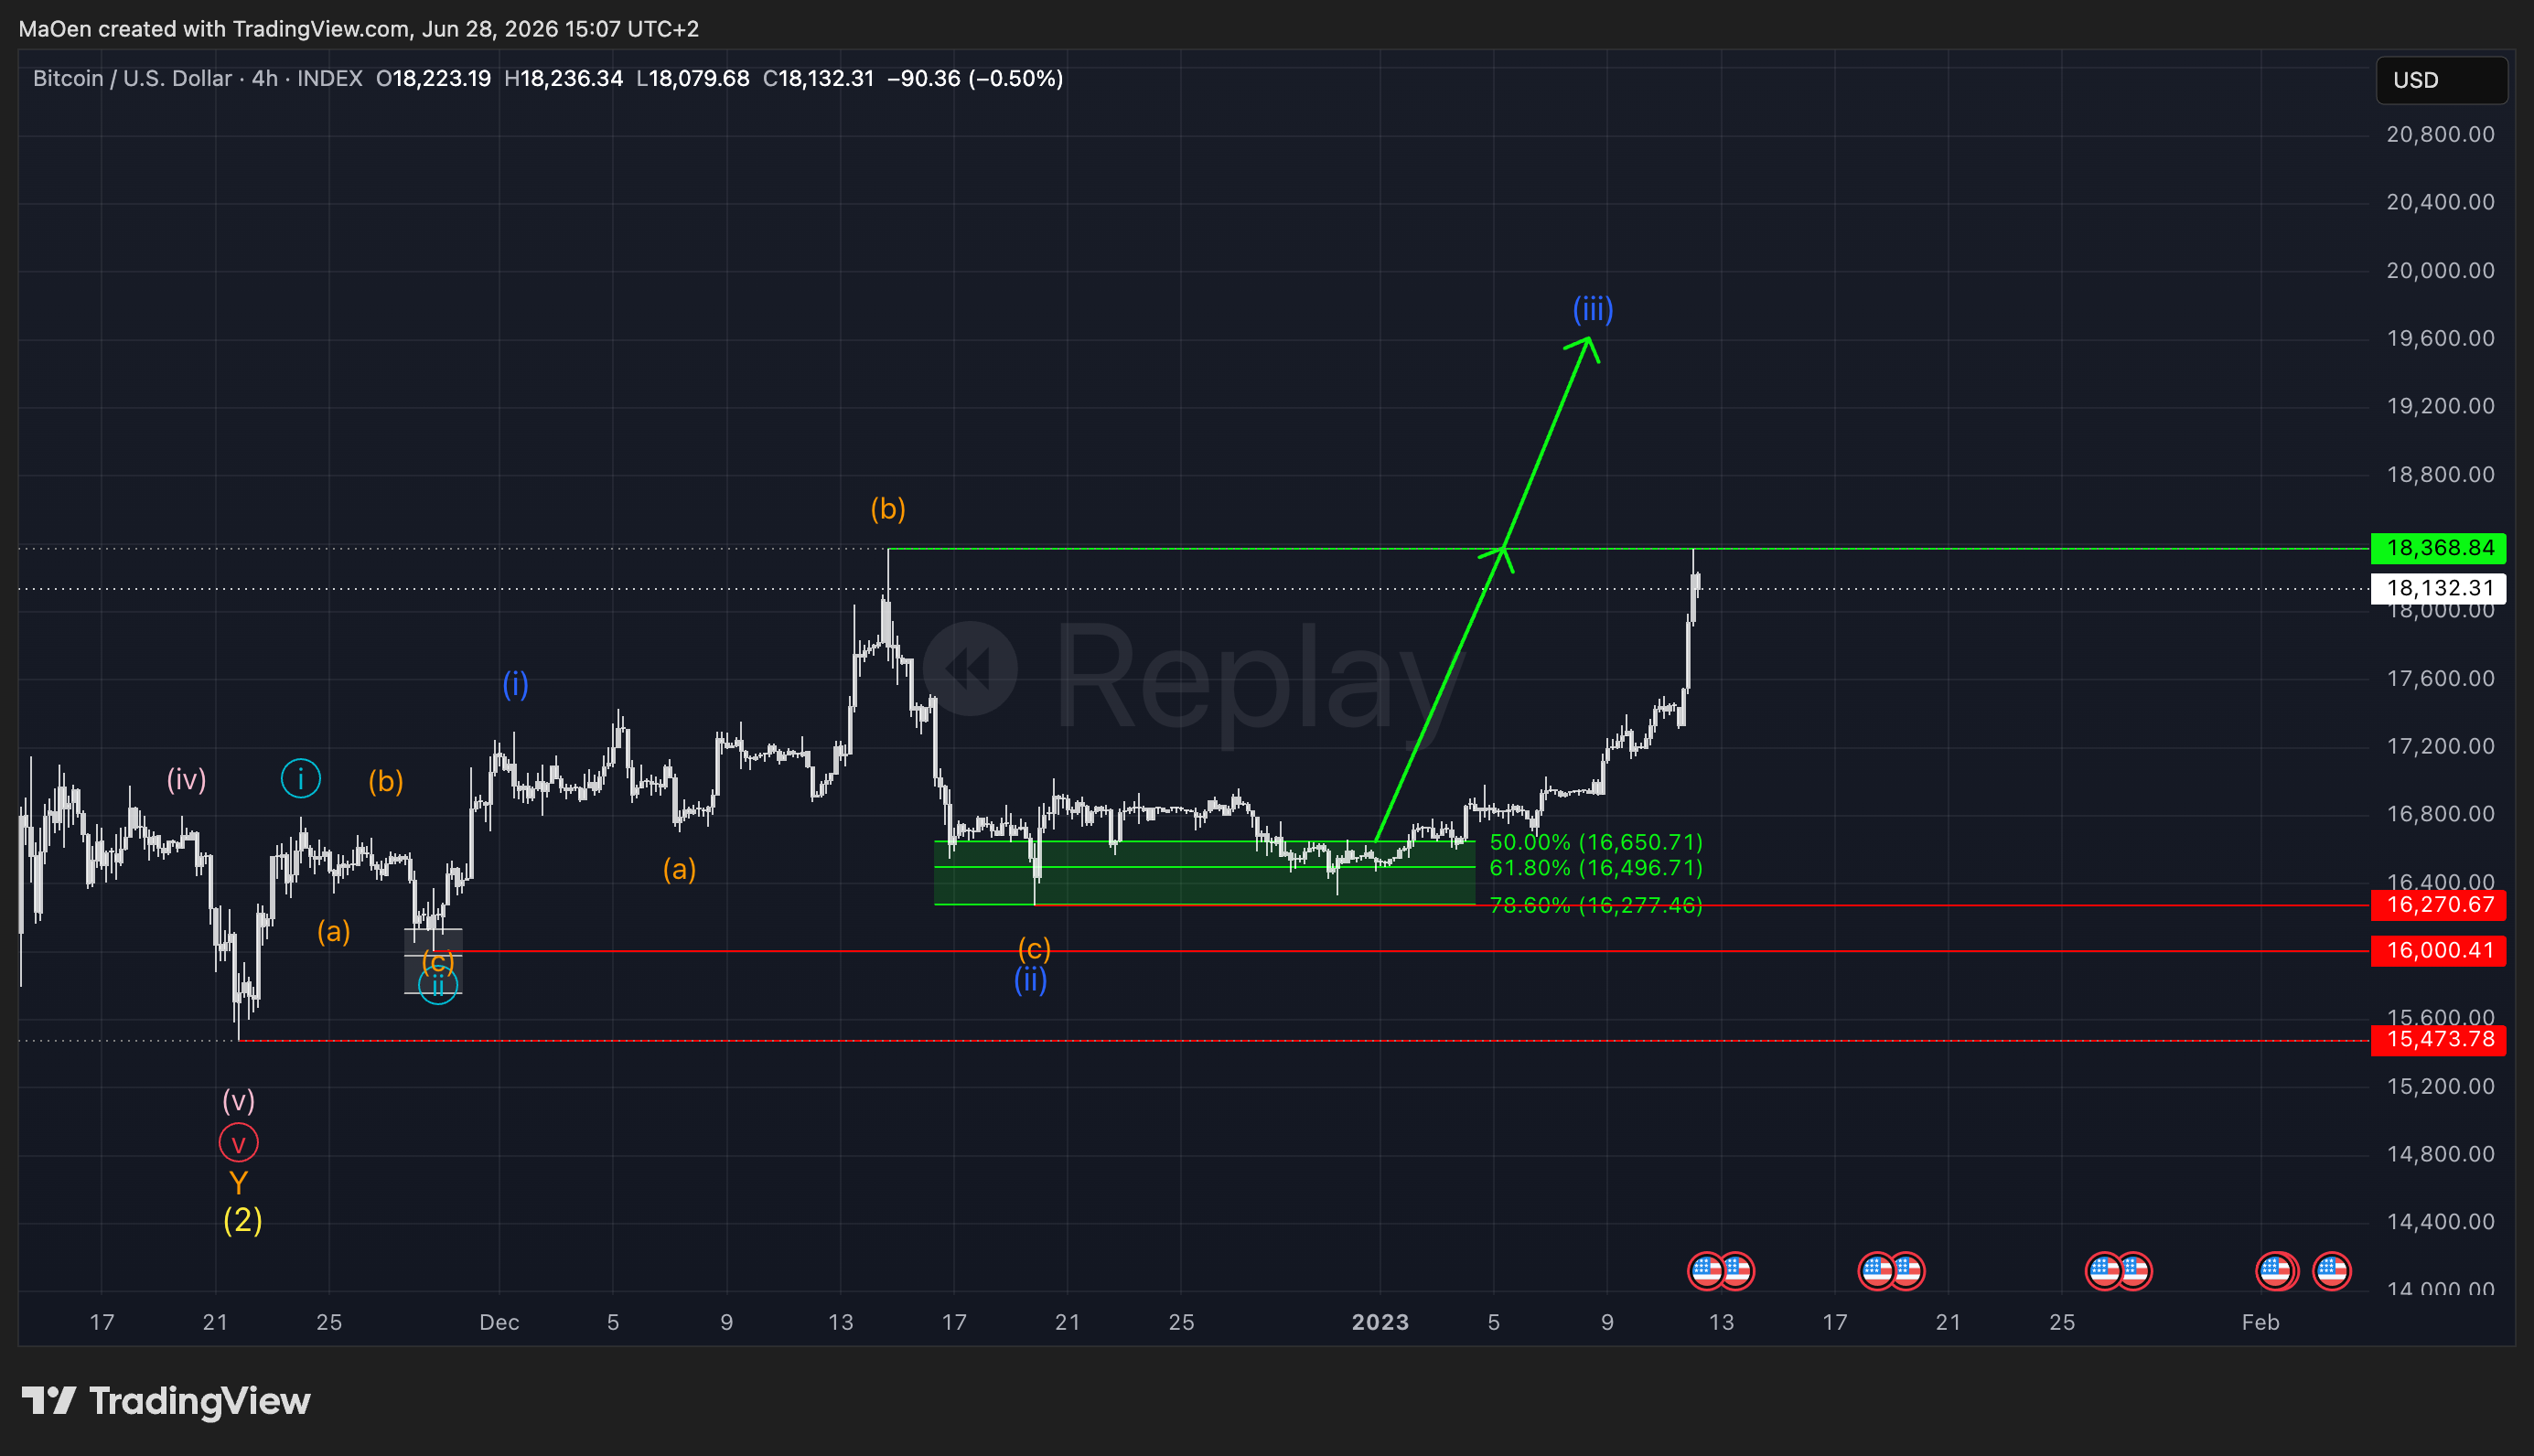
As you can see in the chart above, after the zone was activated the market moved sideways for an extended period — but ultimately confirmed the zone by pushing back up. Once Bitcoin breaks above the high of the overshooting wave b at $18,368, we validate and deactivate our Fibonacci zone. The overshooting wave b scenario is hereby resolved: the alternative did not play out, the zone held, and we are now invested with two perfect entries. From this point, we simply monitor the market as it builds out the full five-wave impulse in light blue.
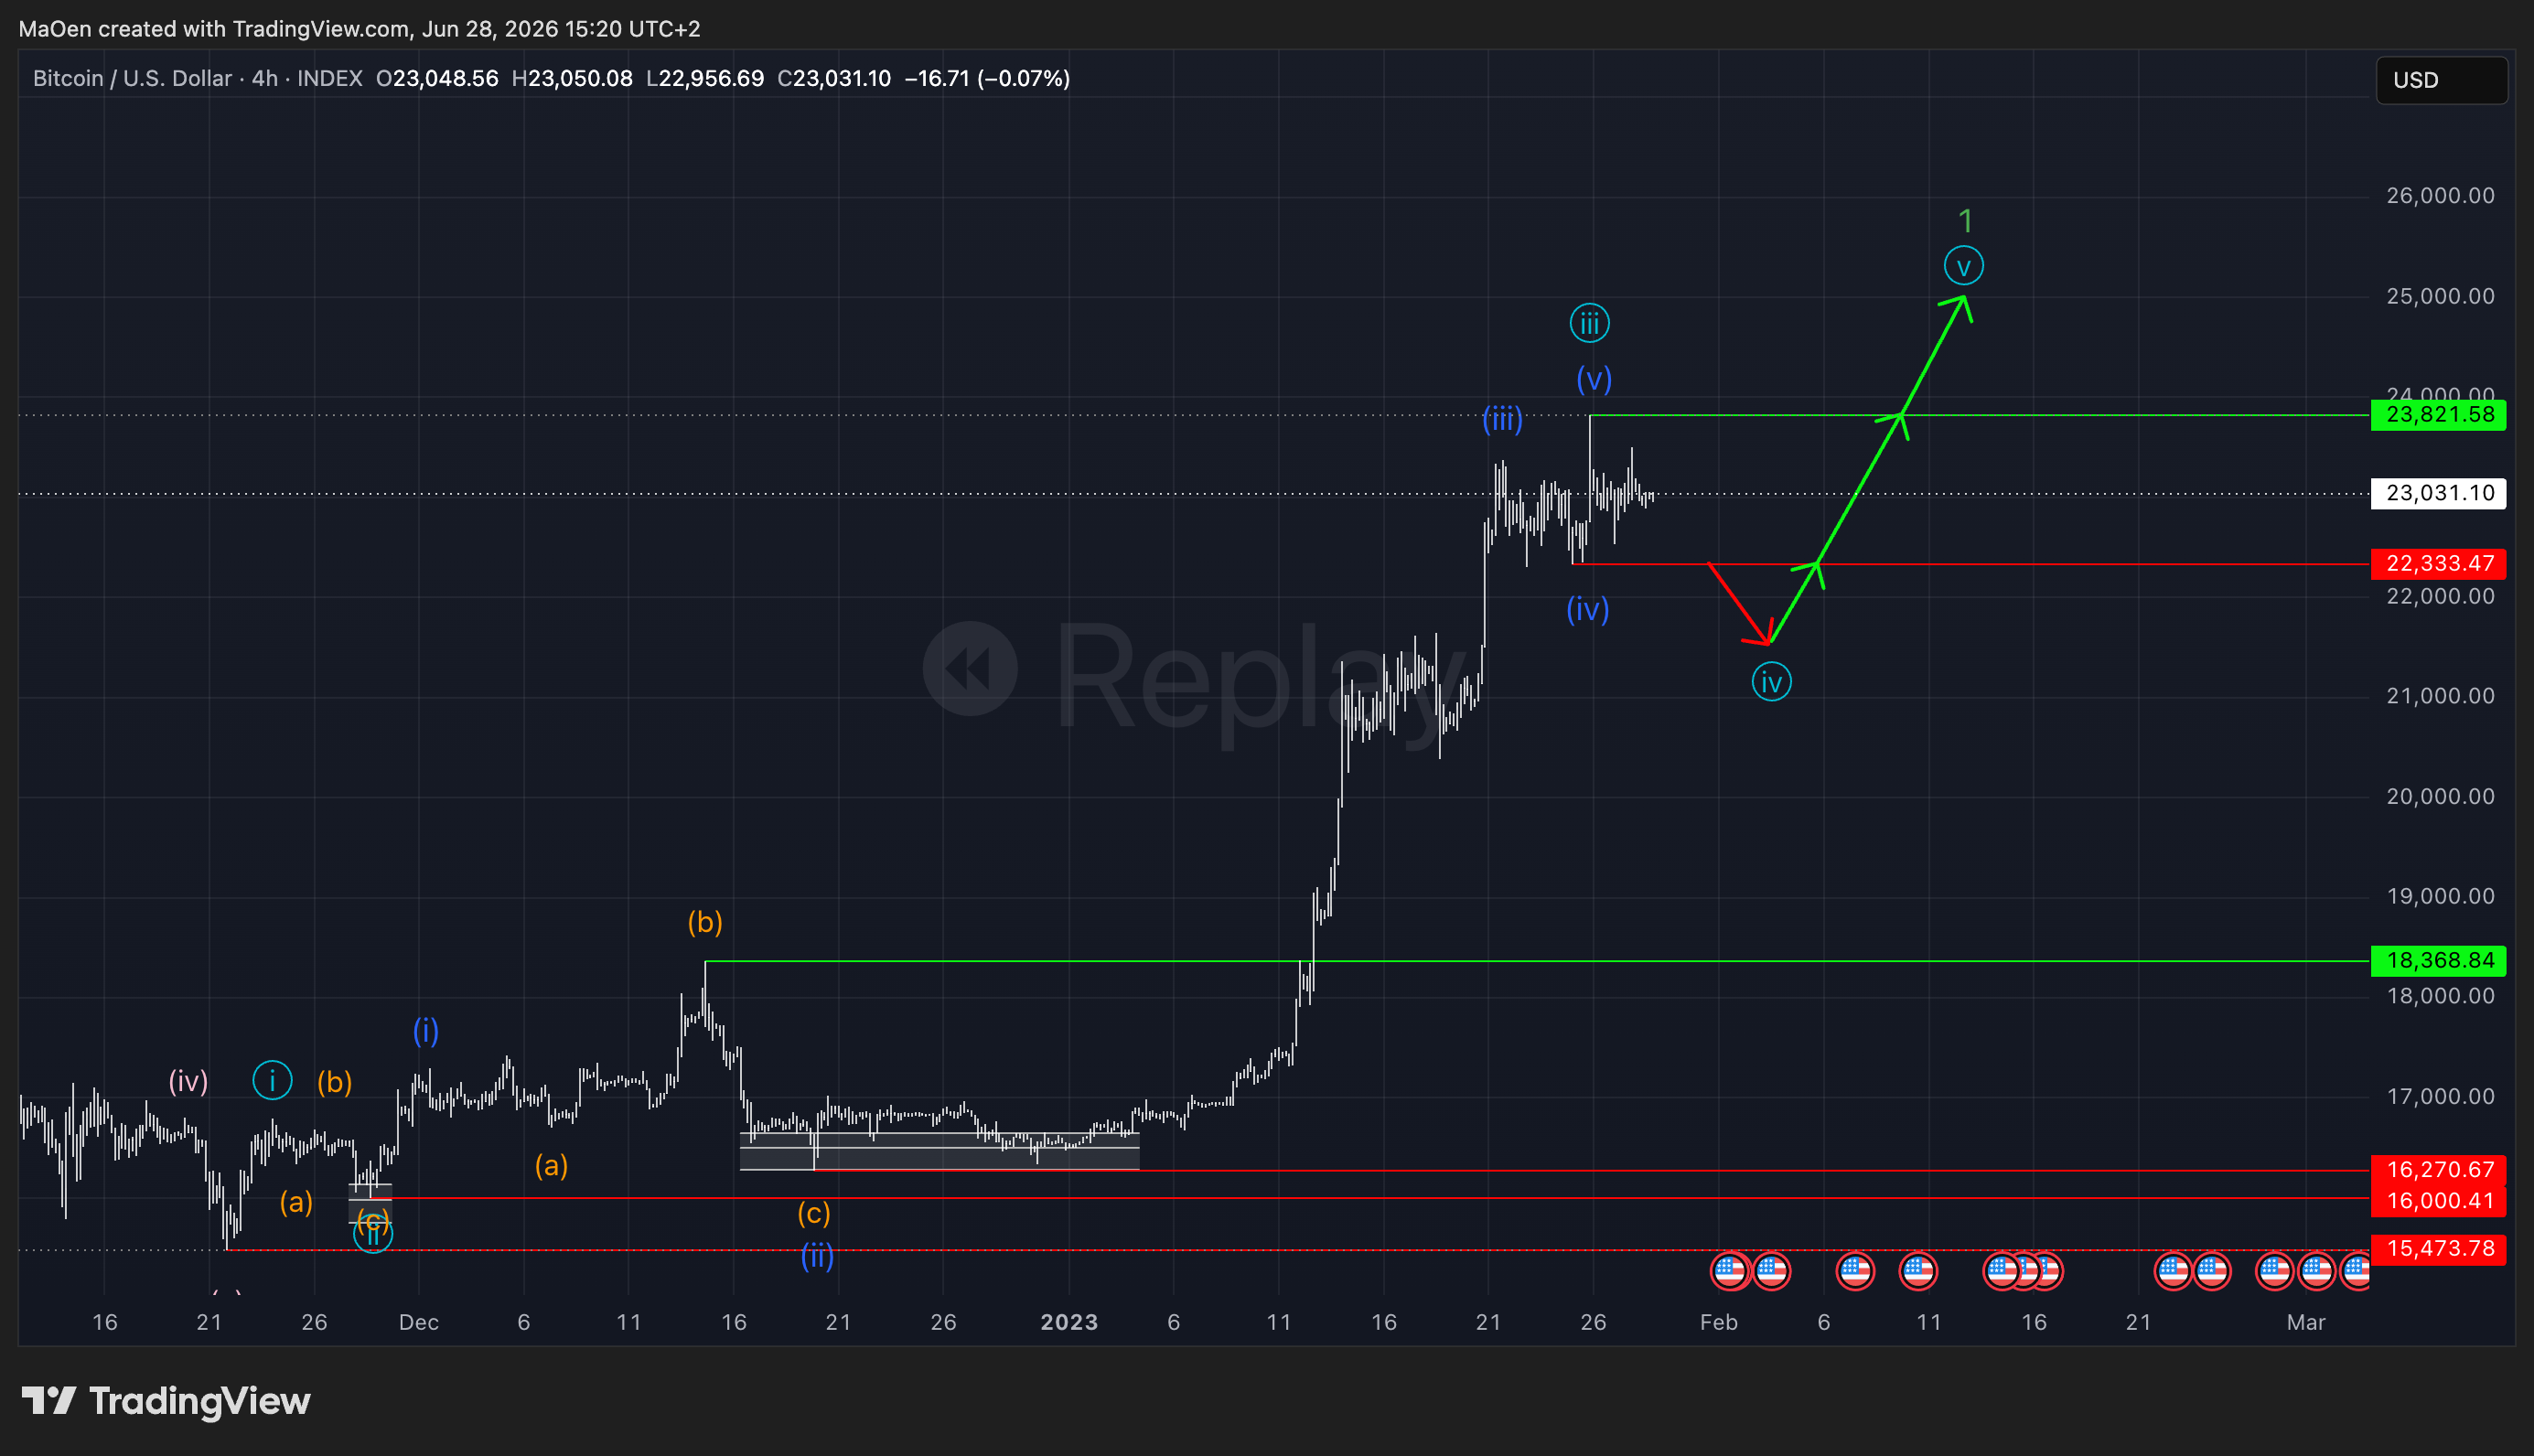
Bitcoin broke far above the high of the overshooting wave b, which is why we successfully validated our second Fibonacci zone and greyed it out. We would now also manage our stop loss by moving it to break even.
With that, we zoom back out to the higher degree. The entire dark blue cycle has now completed, and in doing so, it has built up light blue wave 3. We now expect the market to enter a larger corrective phase to form light blue wave 4, before making one final push higher into light blue wave 5 — which will complete the entire light blue impulsive fractal and create green wave 1 from the higher degree.
For the correction into light blue wave 4, we set a Fibonacci zone where we expect the pullback to find support. This zone is particularly interesting because once it activates, the next expected move is light blue wave 5 — the final leg of the fractal. This makes it a high-quality trading opportunity.
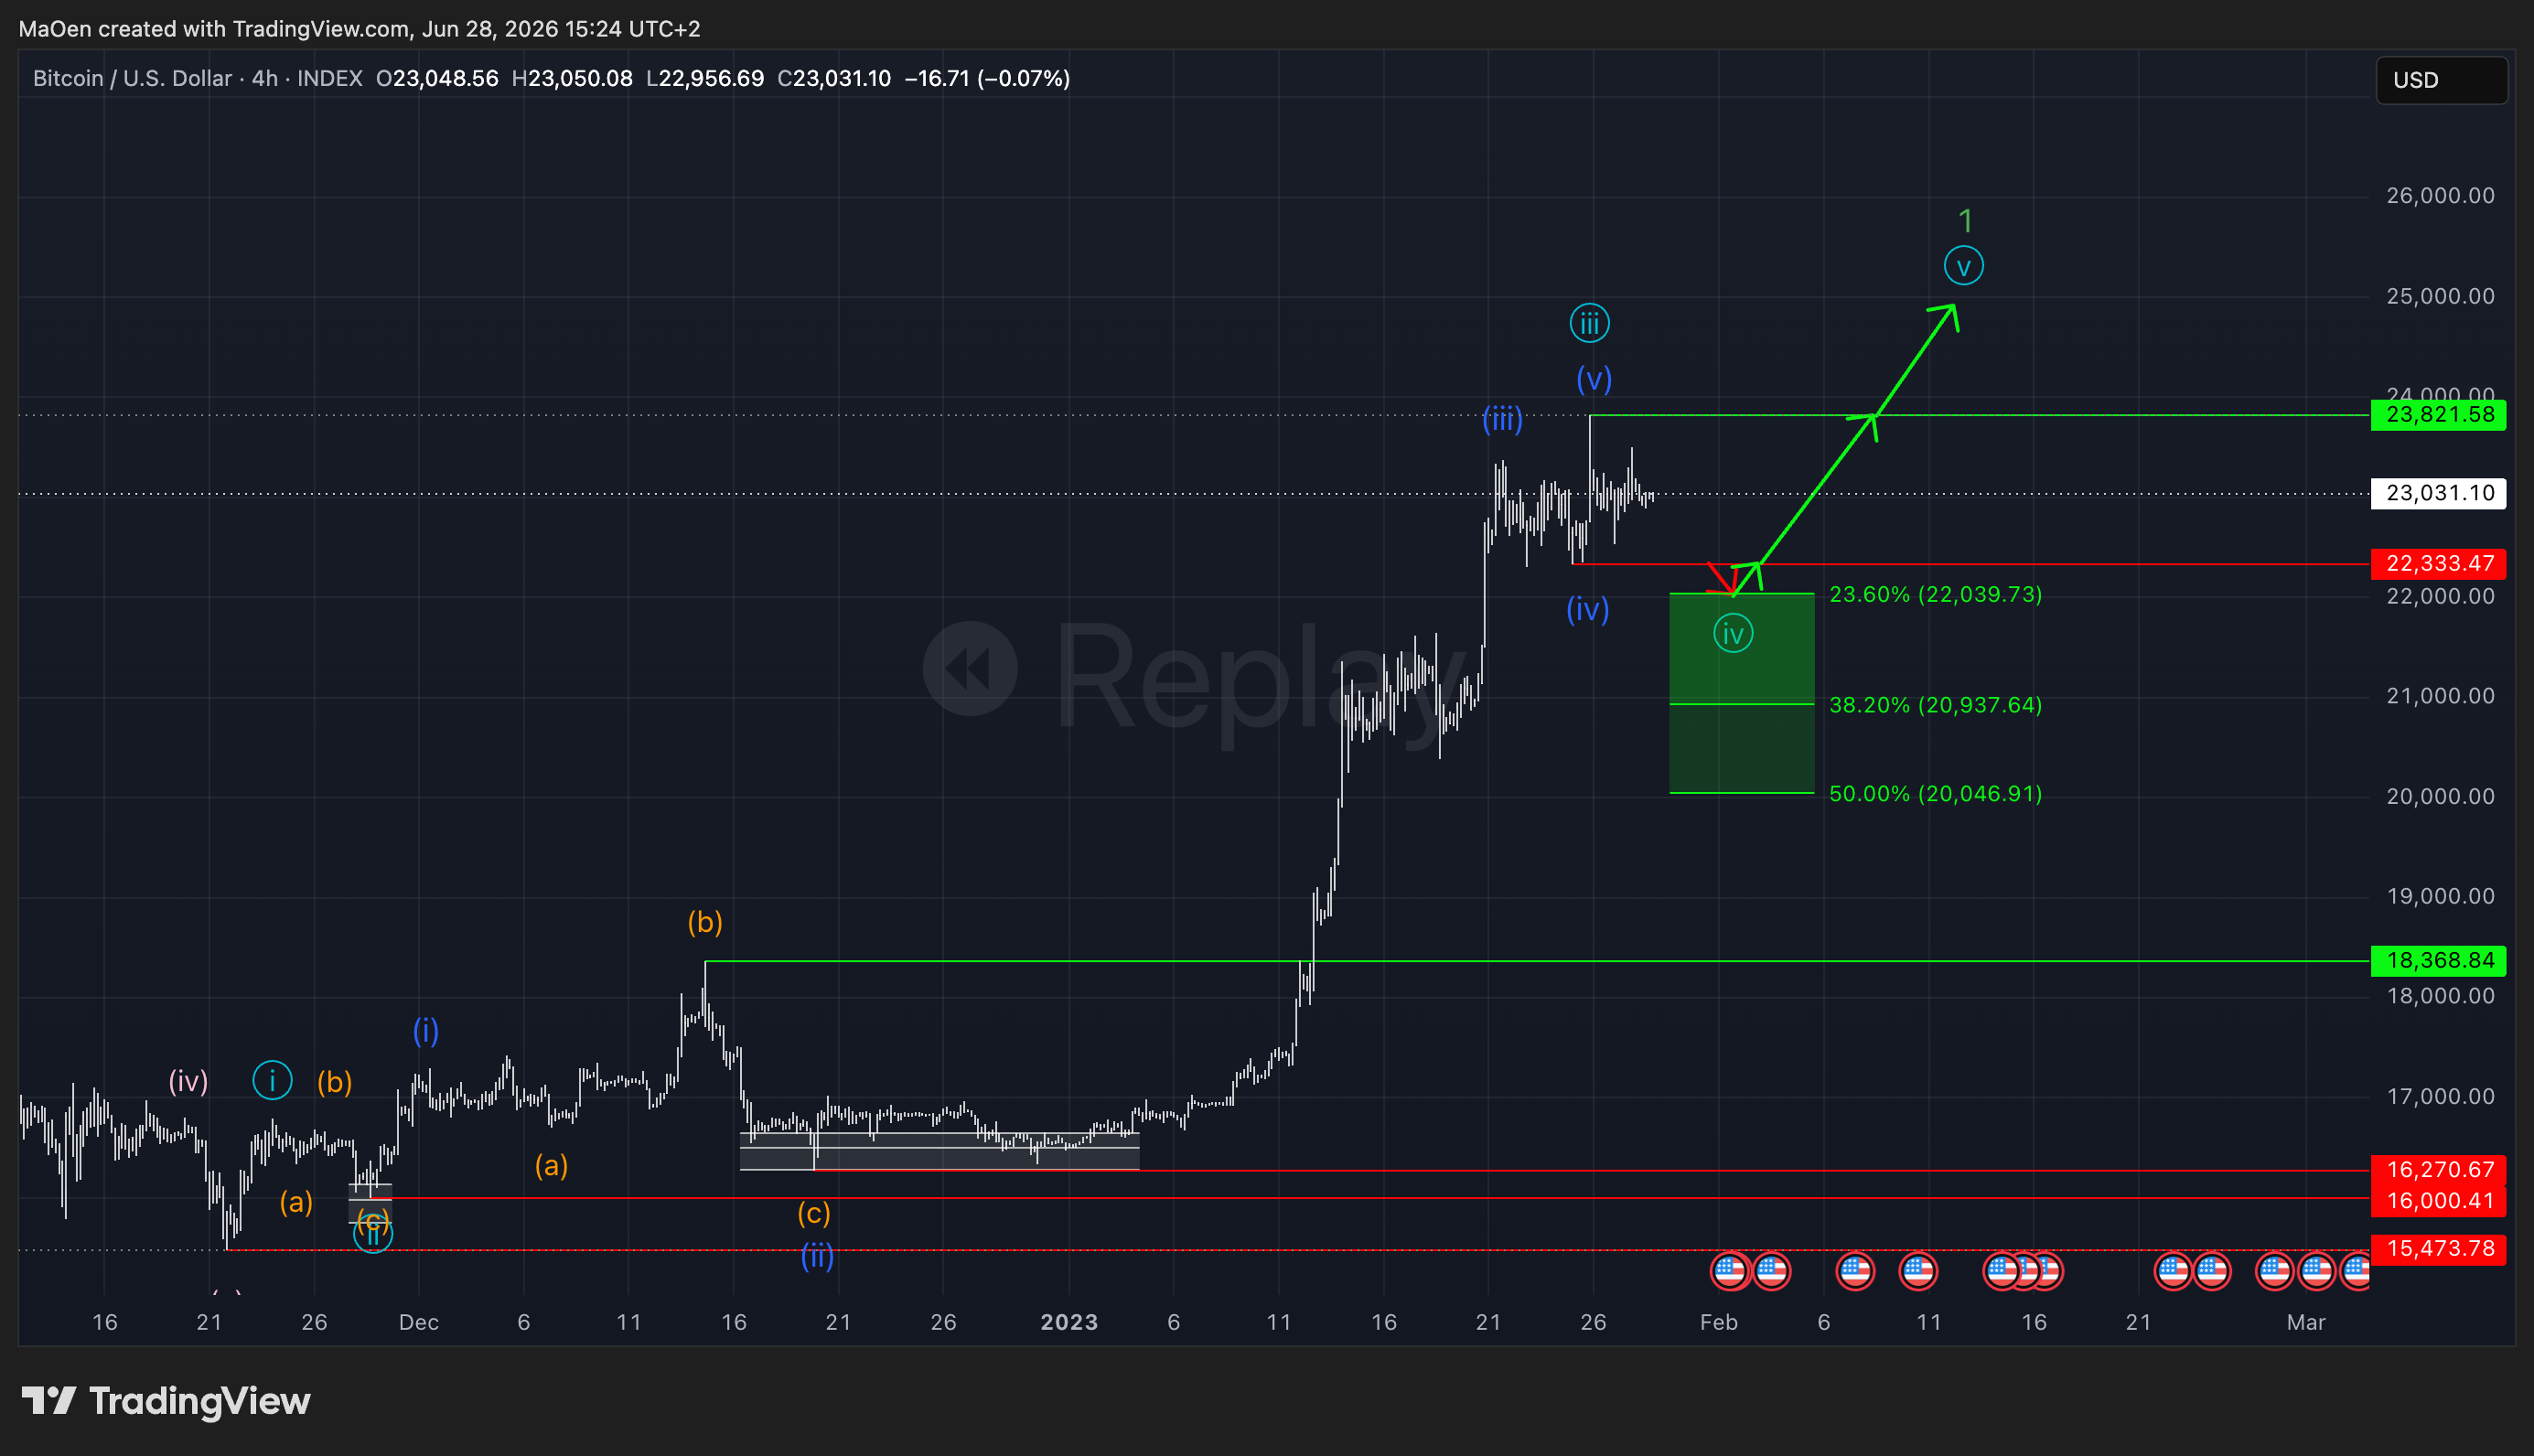
The zone is now set. In the chart above you can see the green Fibonacci zone drawn in for the light blue wave 4 correction.
Long entry levels:
- 23.6% at 22,039$
- 38,2% at 20,937$
- 50% at 20,046$
stop loss:
- 1% below zone at 19,836$
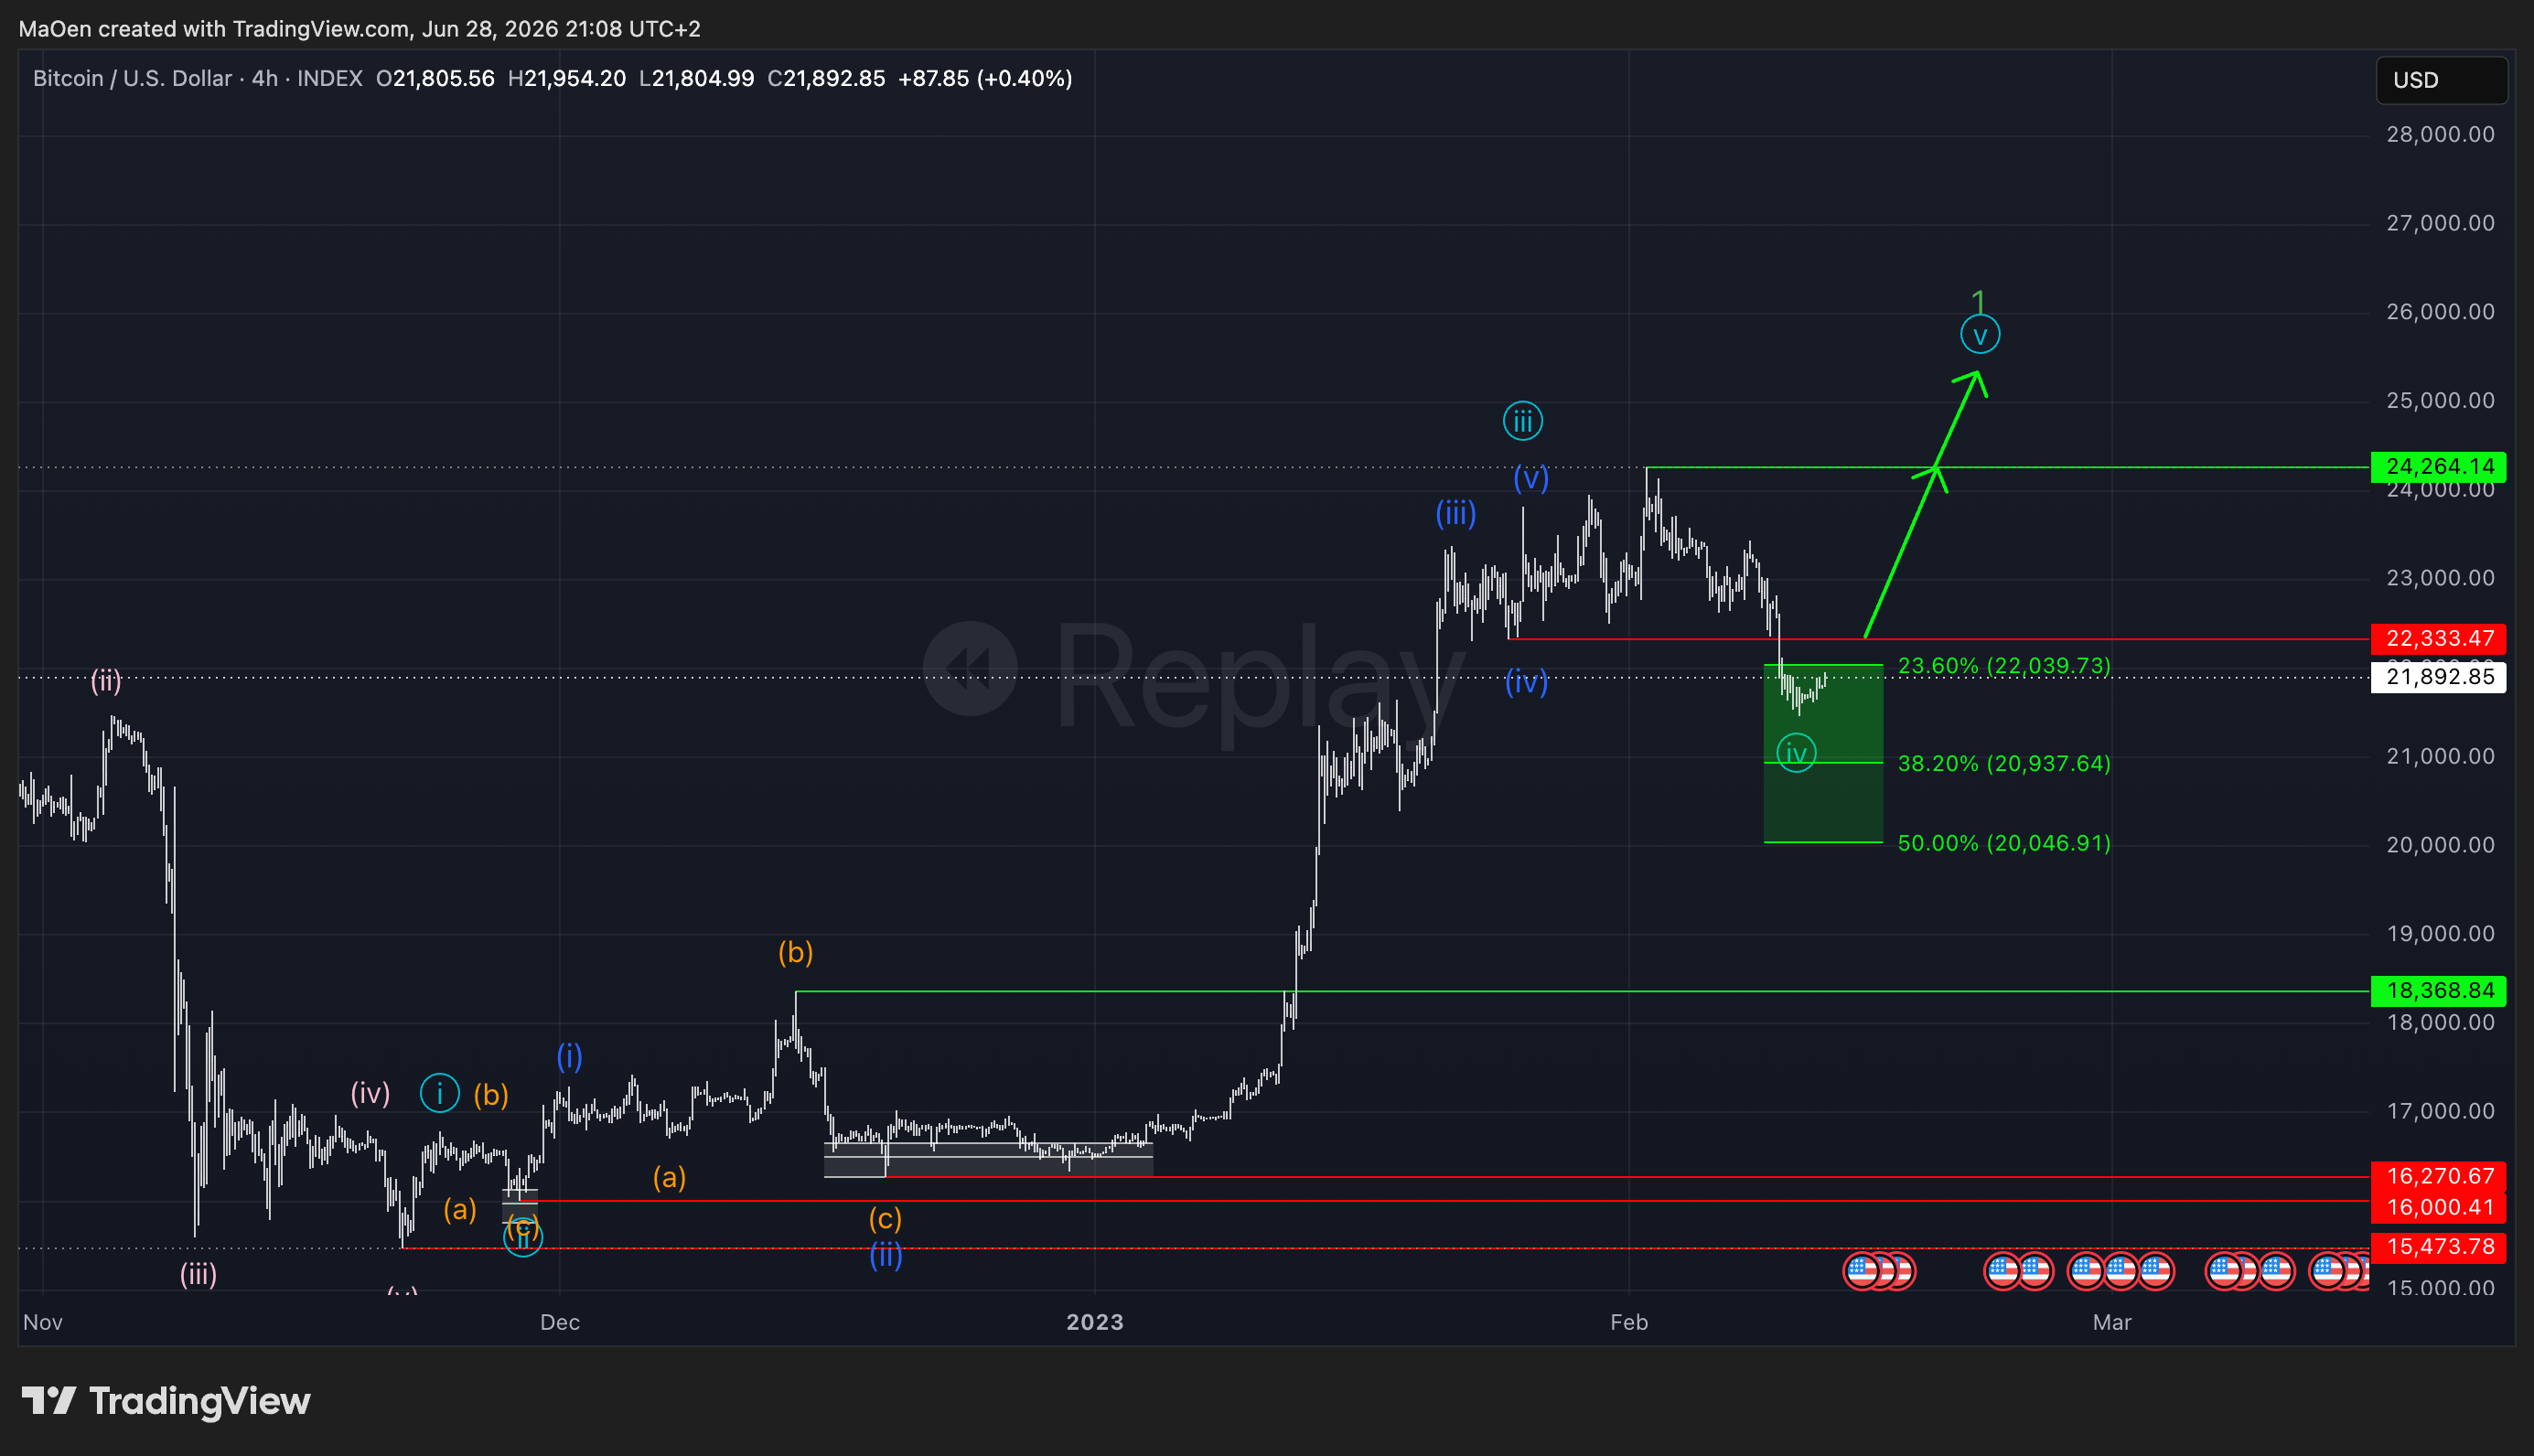
As you can see in the chart above, Bitcoin has once again hit and activated our Fibonacci zone, triggering our buying orders. This is our third entry point in this entire fractal. We now expect the market to push up with a final bullish impulse — light blue wave 5 — completing the entire light blue cycle and finishing the impulsive fractal of green wave 1.
Once the market moves above the high of $24,264, we validate and deactivate the Fibonacci zone.
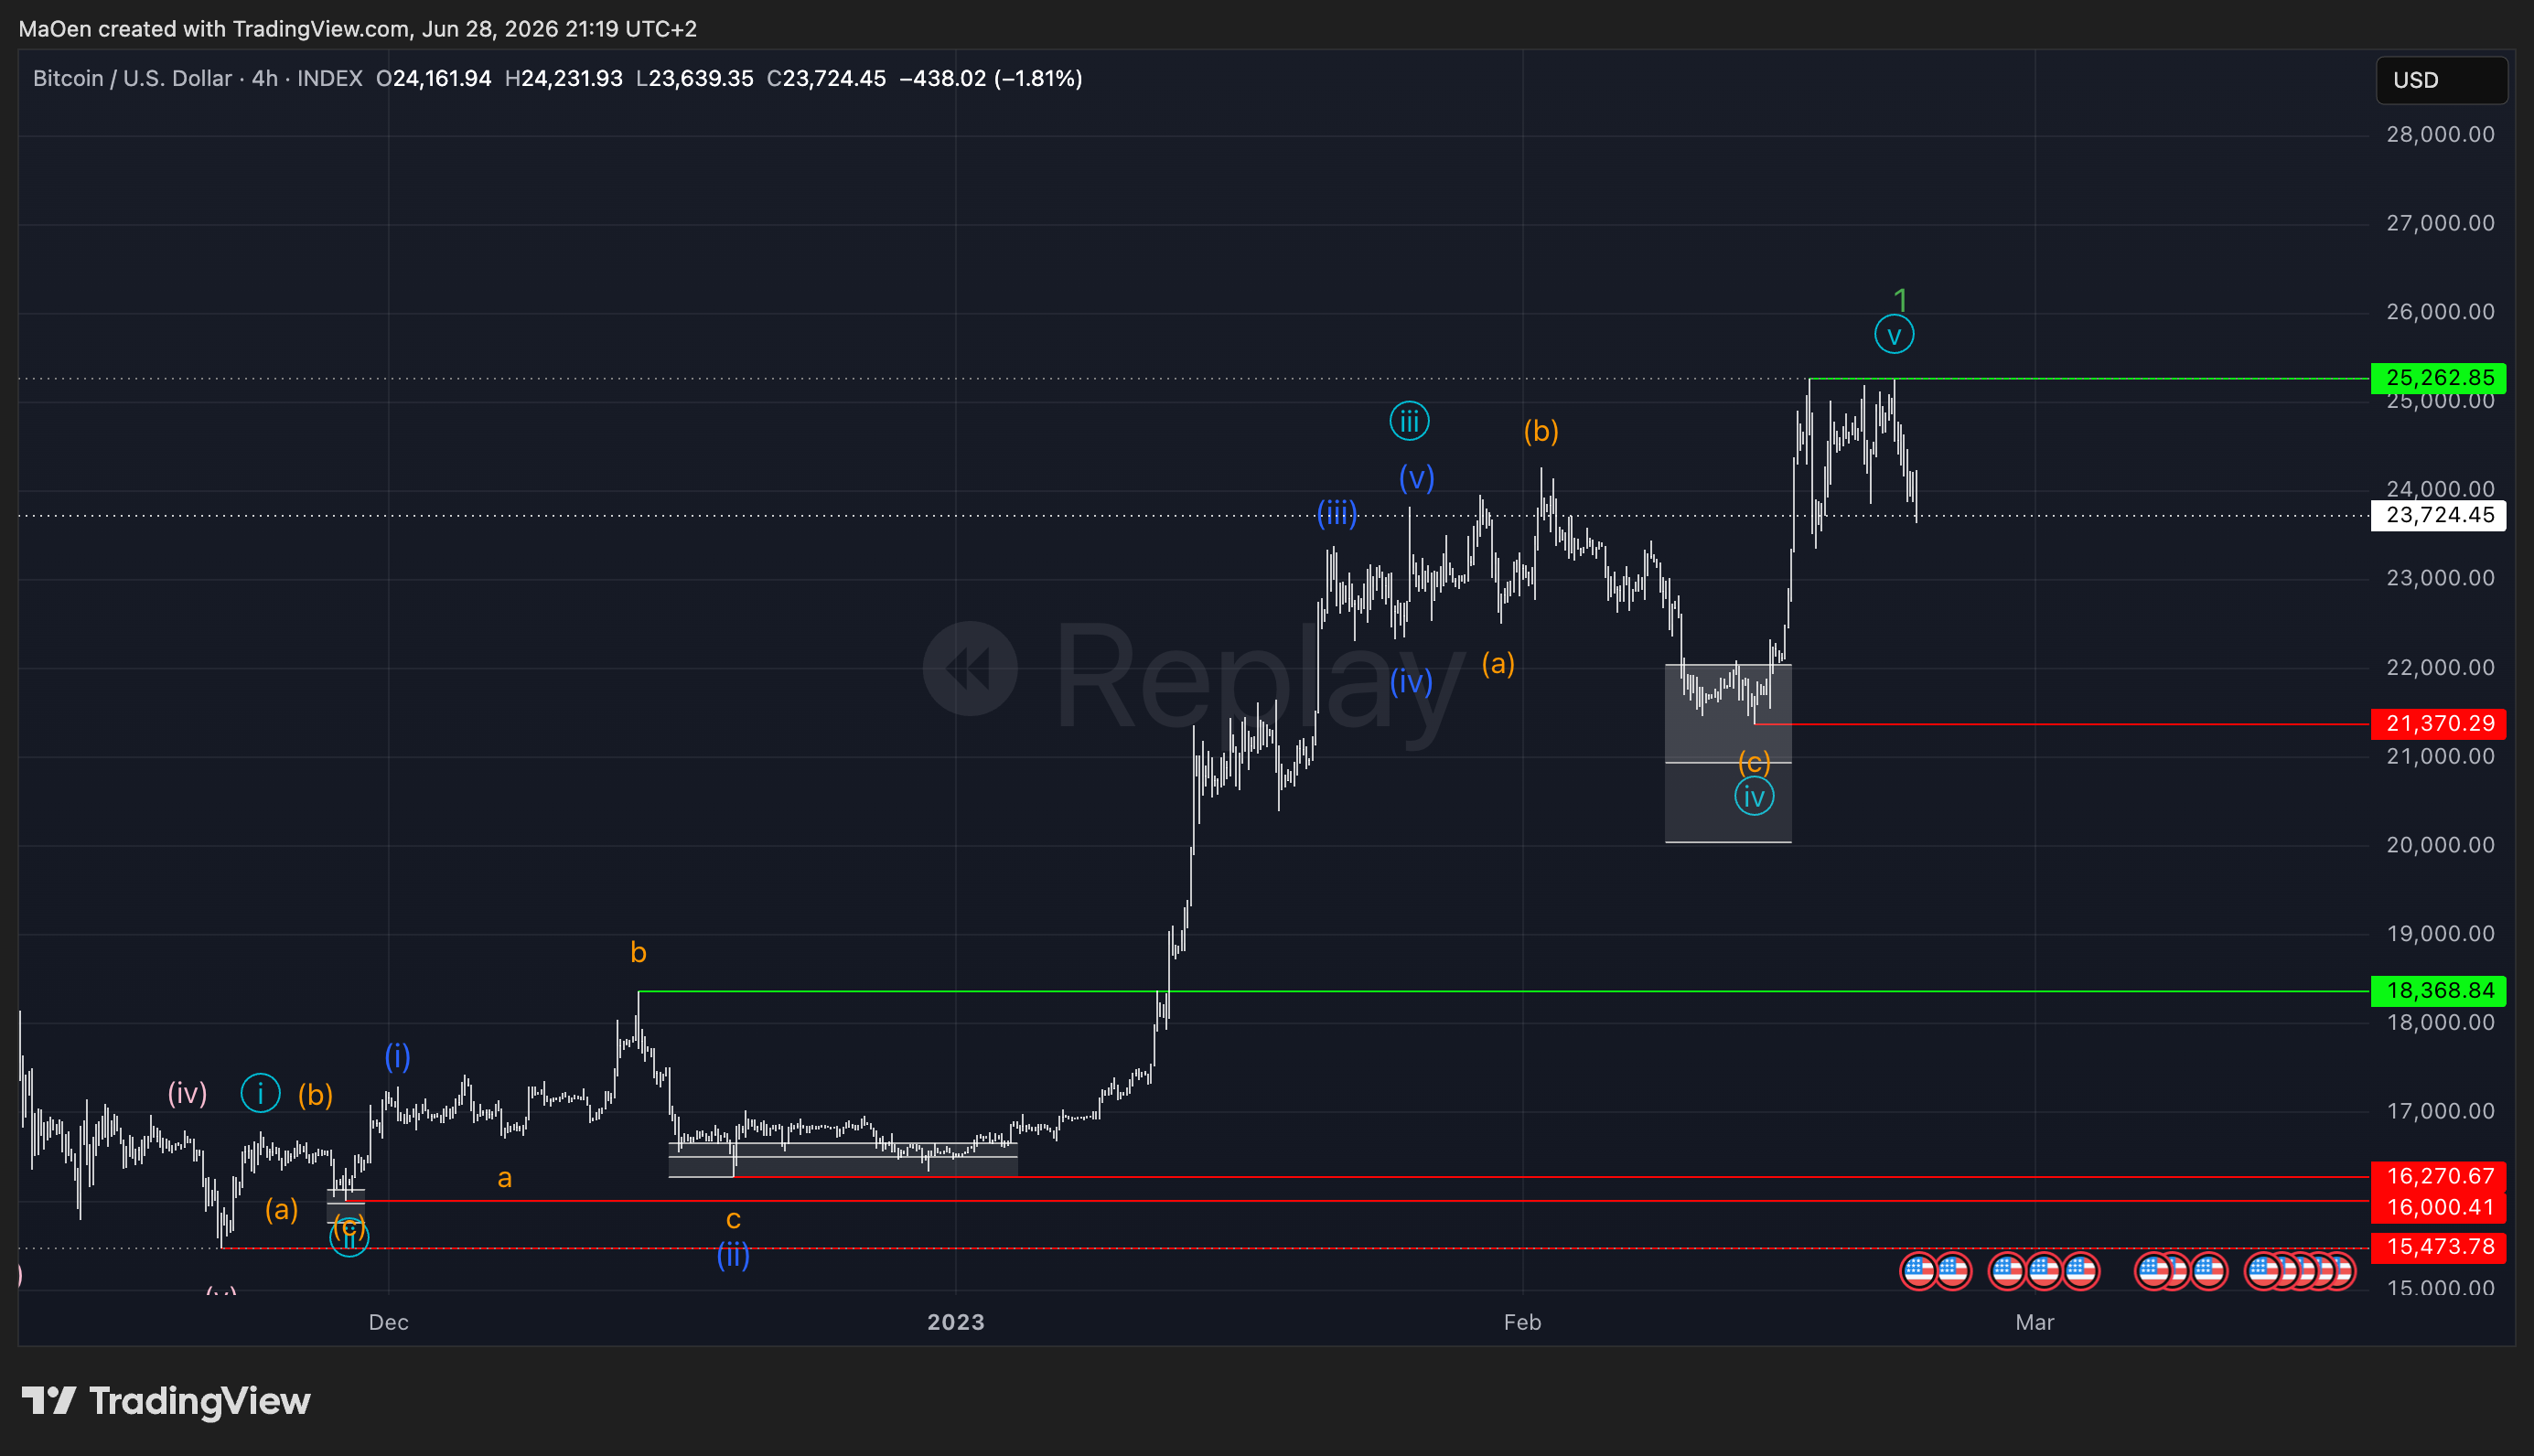
Bitcoin has broken above the previous high, confirming the zone with a successful hit. We validate, deactivate, and grey out the third Fibonacci zone. We once again recommend moving your stop loss to your entry point or slightly above it to protect your gains.
At this point, green wave 1 is likely complete and the market may be entering a major corrective phase into green wave 2. This is where we begin managing positions actively. As soon as we identify a confirmed major high, we will realize profits by selling 25 to 50% of our positions to secure gains while staying in the market, if we want be invested in the long-term.
Sometimes we define clear price levels where it would be an opportunity to sell the market or to work with put options to hedge your positions properly.
We think this is the best approach to stay on the winning side after entering the market via our clearly defined Fibonacci zones. If the market then reaches newly defined Fibonacci zones, we will also outline them as a perfect opportunity to realize short positions or put options.
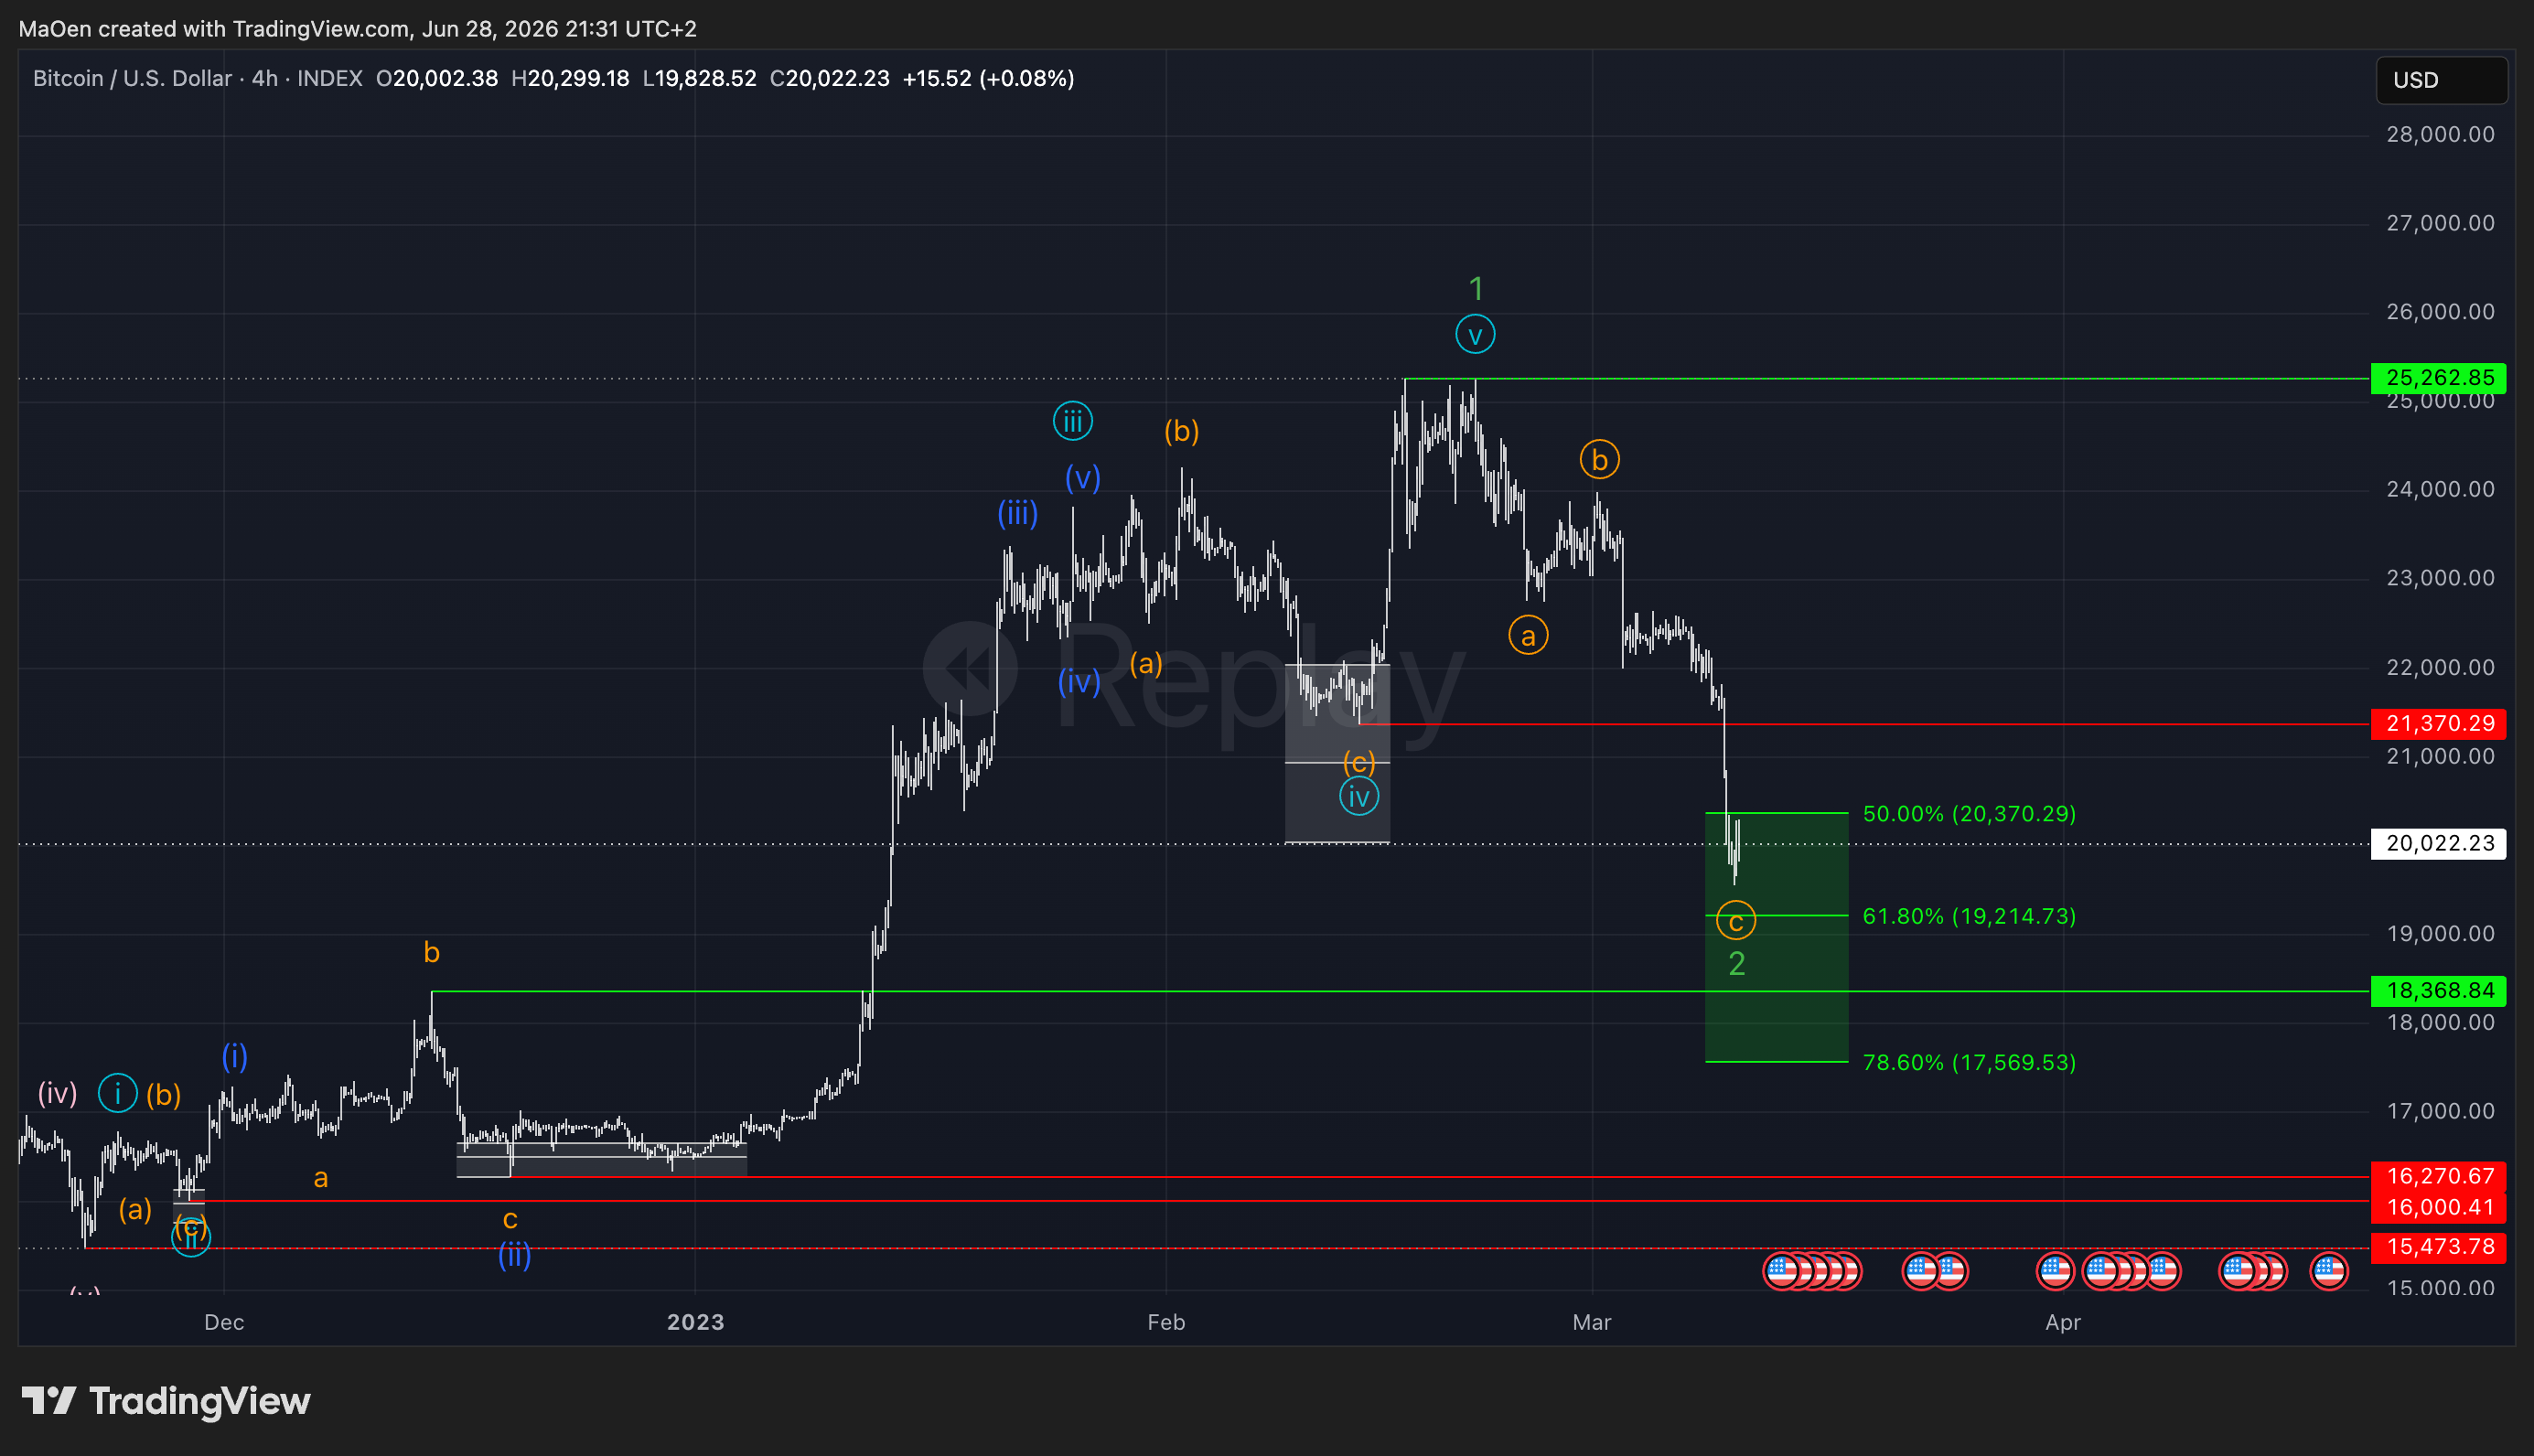
Bitcoin has now created green wave 1 and has also reached and activated a defined Fibonacci zone for the green wave 2 correction. Once green wave 2 is officially complete, the entire long-term impulse cycle — green wave 1 and 2 — will be finished. At that point, the stage is set for what we expect to be a massive rise in prices into green wave 3 over the long term. So from now on onwards the elliot wave structure would basically be the same as from the starting point at the bottom of the longterm corrective phase of yellow wave 2.
We hope this guide gives you a clear picture of how we approach our analysis at Monalytics — from identifying clear bottoms or also Tops, to setting Fibonacci zones, managing entries across multiple degrees, and finally taking profits. In this example, Bitcoin followed the Elliott Wave structure almost perfectly, allowing us to place three successful entries along the way. The process is always the same: we identify the structure, set a zone, wait for activation, manage the risk, and let the market do the rest. It is important to understand exactly what we expect to happen at each stage, and we always try to present it as simply and clearly as possible in the charts. Our rules are non-negotiable — entry levels, stop loss, and risk management are always defined before we enter. Anything can happen in the market at any time, which is why a stop loss is not optional. Be aware of your own risk tolerance. And most importantly: we strongly recommend only entering the market when it is within a previously defined Fibonacci zone. No zone, no trade.