Google (GOOG)
Google Ends Its Cycle
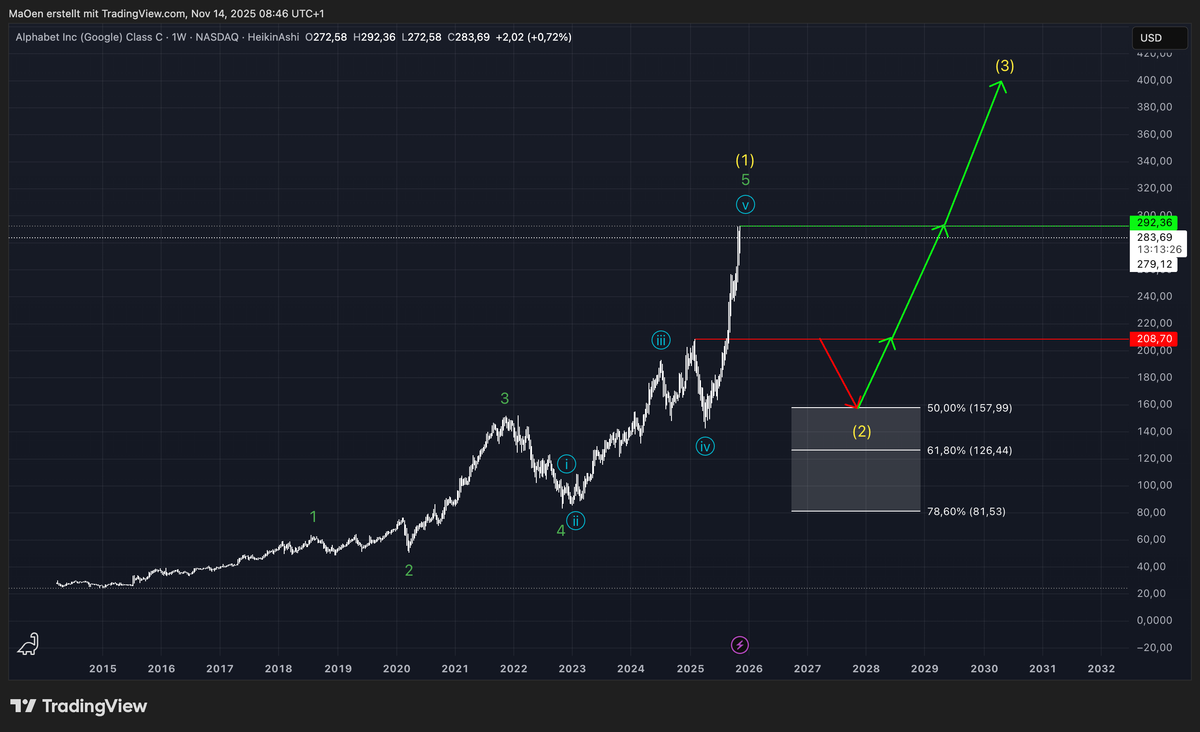
Since 2014, Google has been in a strong long-term uptrend, unfolding as a green cycle that is now moving into its final impulse: green wave 5. This entire green cycle, however, forms yellow wave 1 — the first sequence of a much larger major cycle.
We now expect Google to complete its all-time high and transition into a corrective phase, unfolding as yellow wave 2. Once Google tops and begins its initial downward move, we will look for a break below local support at $208.70 as the key confirmation of this expected trend shift.
If this trend reversal is validated, we will publish our usual Fibonacci retracement zones, highlighting the areas where we expect Google to regain bullish momentum and complete its corrective yellow wave 2. From there, the stock would be positioned to start a new major impulse into yellow wave 3 — typically the strongest and most dynamic wave in Elliott Wave theory.
The Fibonacci retracement zone shown in the current chart is not our final expectation for yellow wave 2. If Google confirms our long-term outlook, we will adjust the chart accordingly and communicate those updates immediately.
Looking at the short-term picture, we expect Google to prepare for one final upward move before the cycle completes.
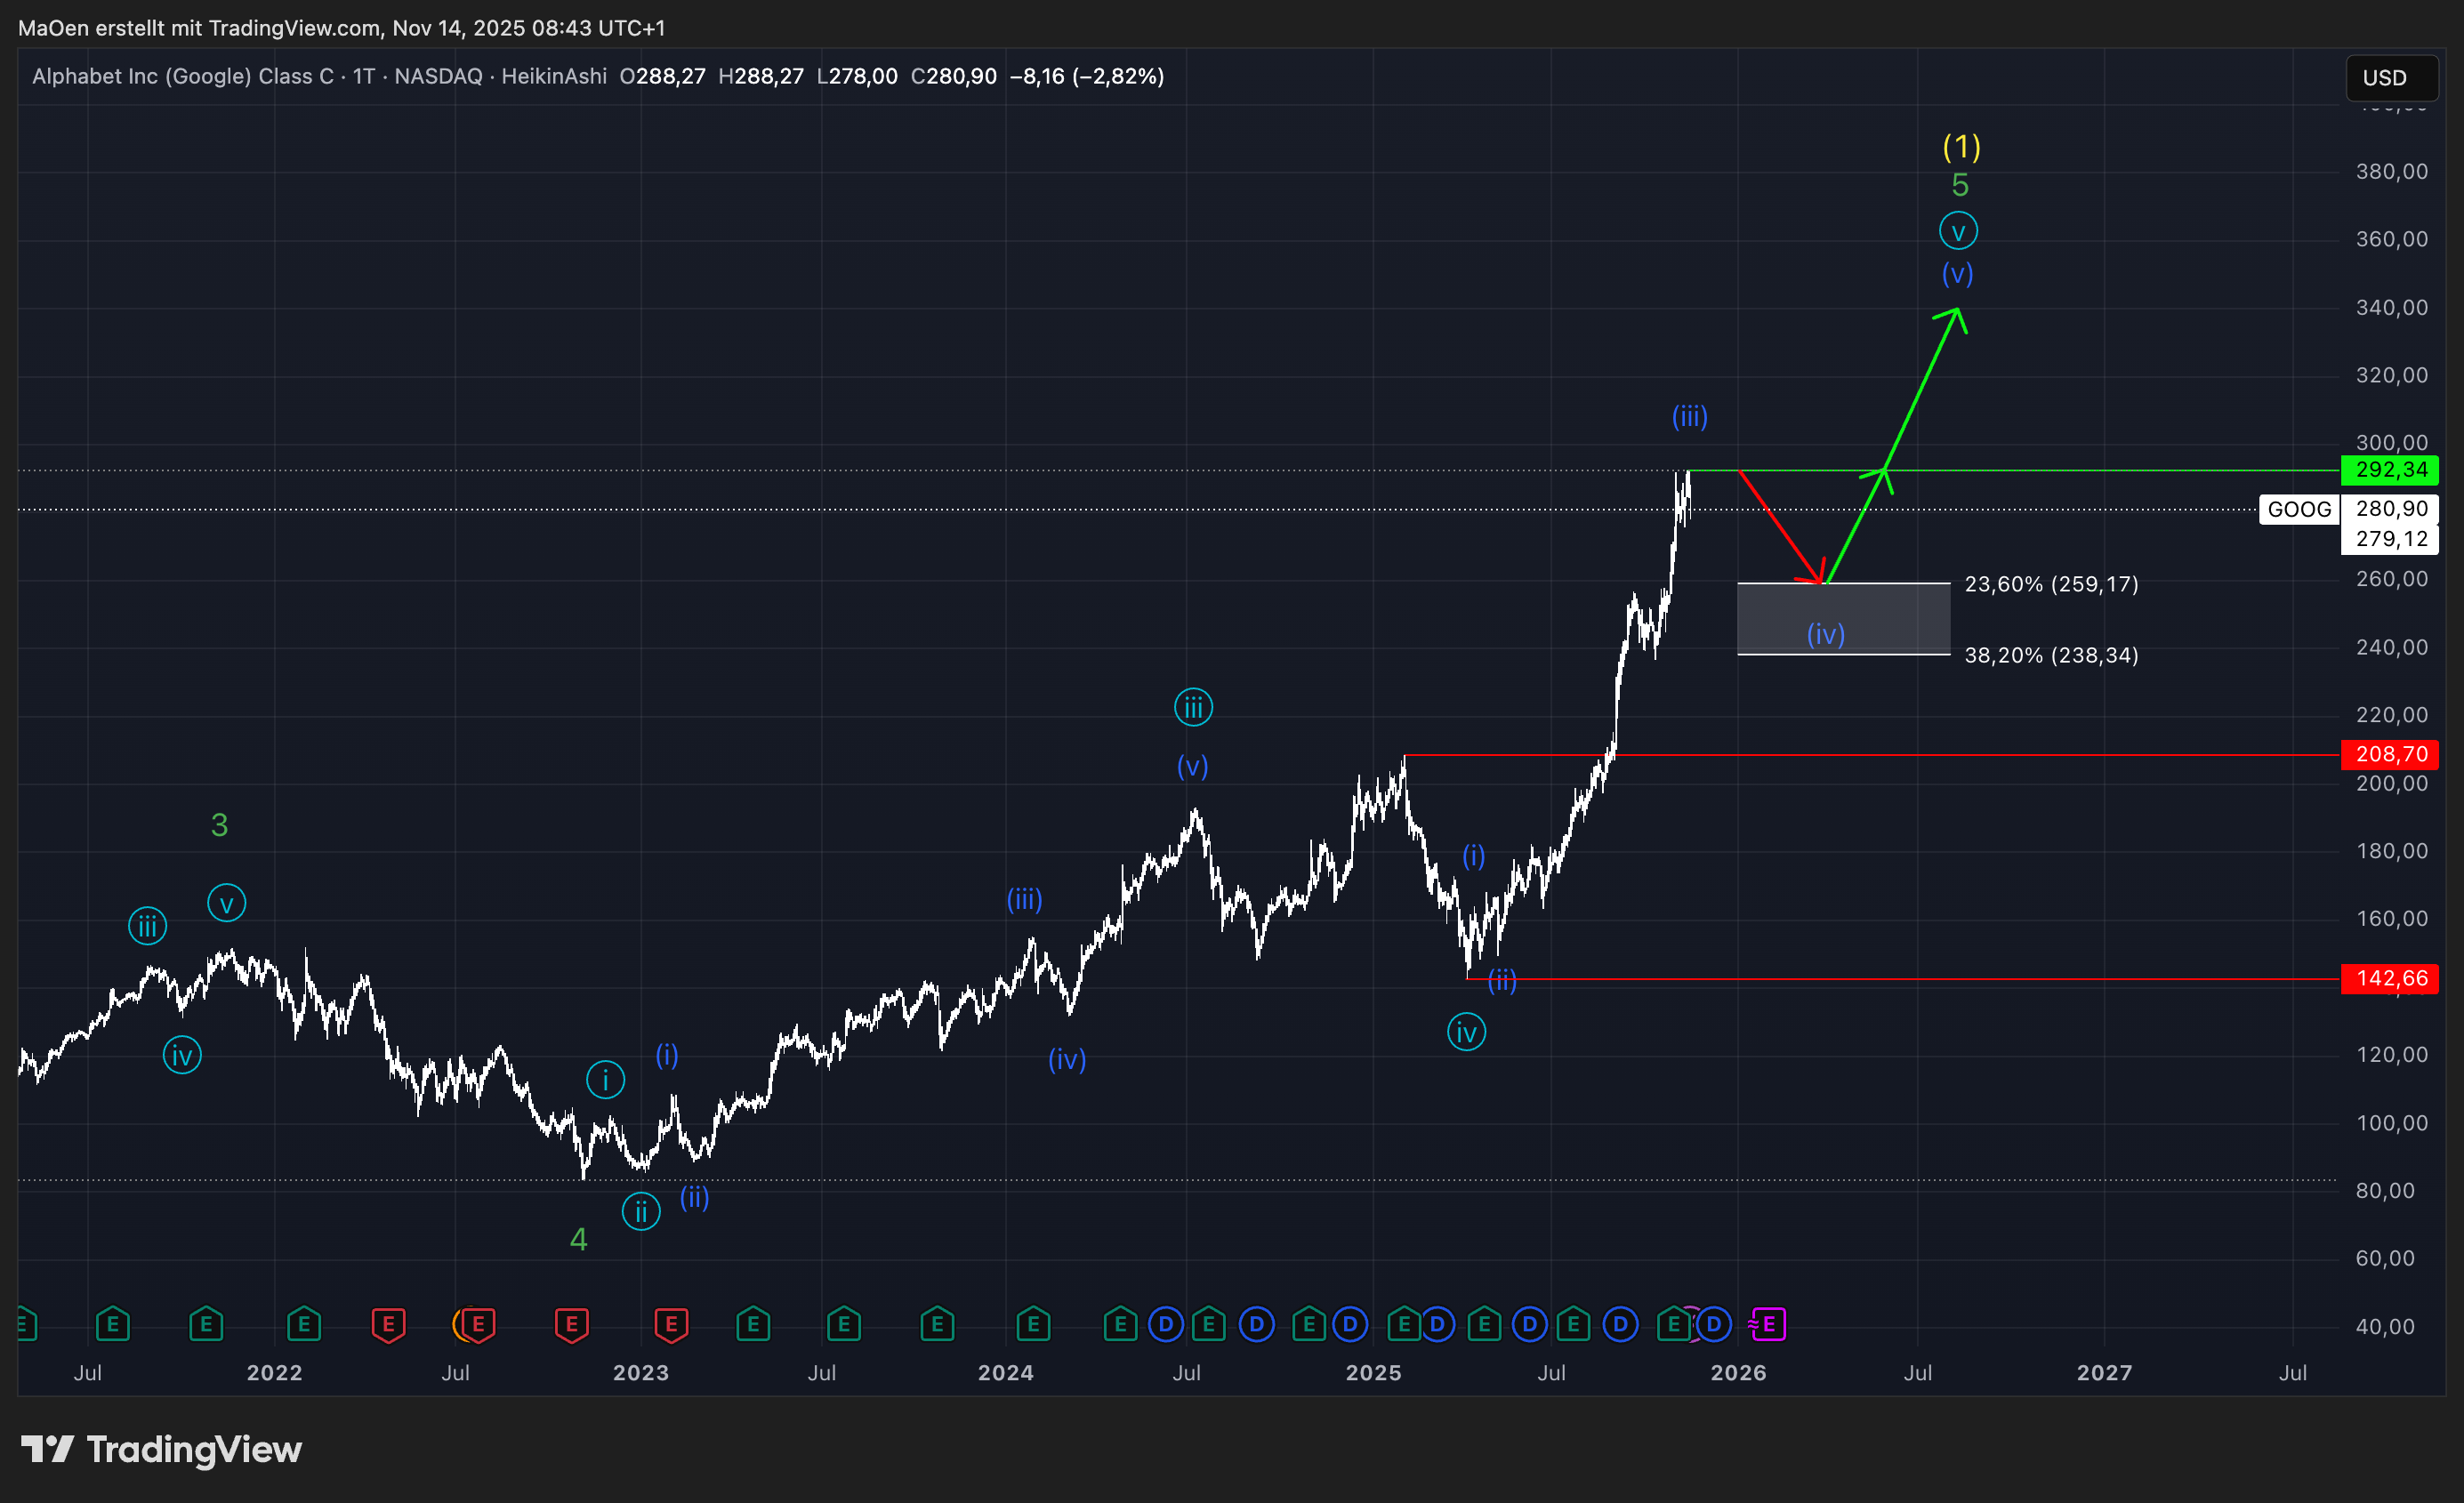
After reaching its all-time high at $292.34, marked in neon green, Google began to show the first signs of weakness, suggesting that a short-term correction is underway. As illustrated in our chart, we believe Google is now in the final phase of completing a major top with yellow wave 1.
At the moment, our focus is on the dark blue cycle. After completing the corrective light blue wave 4, Google initiated a dark blue wave 1, followed by a wave 2 pullback and then an impulsive dark blue wave 3, which culminated at the recent all-time high. We now anticipate the development of a corrective dark blue wave 4. For this short-term retracement, we have defined a Fibonacci zone between the 23.6% level at $259.17 and the 38.2% level at $238.34. Within this area, we expect dark blue wave 4 to complete and for bullish momentum to return, pushing the stock above its current all-time high to form dark blue wave 5.
Once the dark blue cycle concludes with wave 5, it will also complete light blue wave 5, which in turn finalizes green wave 5 and thereby completes the major first sequence into yellow wave 1.
Trading Plan:
From our perspective, this Fibonacci retracement zone represents the final buying opportunity before Google fully tops out. It offers an attractive setup for short-term buyers aiming to exit once Google reaches a new all-time high, which remains our primary expectation.
If Google enters our retracement zone, the stock is preparing for its last dance.
Our Sentiment:
To summarize our view on this stock, we remain short-term bullish and fully aligned with our current analysis. However, our long-term outlook clearly signals the beginning of a broader corrective phase. For that reason, we hold a long-term bearish stance until yellow wave 2 completes and we can define the final Fibonacci retracement zone that will offer new potential buying opportunities.