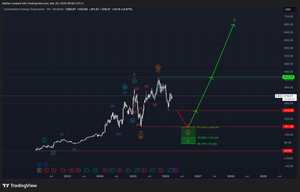
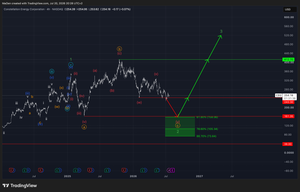
Constellation Energy is still trading within its long-term correction. However, this stock is already in its final leg of this long-term corrective phase. We expect the market to break sustainably below $243.30 in order to reach our defined Fibonacci retracement zone.
Long Entry Levels:
- 61.8% at $158.06
- 78.6% at $105.34
- 88.7% at $73.64
Stop Loss (for active traders): 1% below the zone at $72.89
We expect this zone to bring the long-term correction to a close, finalizing green wave 2 and initiating the next bullish sequence — pushing into a long-term uptrend and forming green wave 3.
However, as Constellation Energy has not yet reached and activated this zone, we anticipate a significant sell-off to occur before this stock activates our Fibonacci retracement zone.
Should anything happen with this stock, we will update you immediately.
Kind regards,
Monalytics
DISCLAIMER: The content on this website, including charts, analyses, and recommendations, is for informational purposes only and does not constitute financial, investment, or professional advice. Trading and investing involve risk. You should consult a qualified financial advisor before making any investment decisions.