ASML Holding (ASML) EW-Analysis
ASML, near to its major top.
Since 2003, ASML has delivered a massive rally and established a strong long-term bull market. In 2004, the stock formed its first bullish impulse within light blue wave 1, followed by a corrective light blue wave 2. This initial impulse marked the beginning of a structural long-term uptrend, which has expanded significantly over the years, particularly accelerating in recent times.
After corrective light blue wave 2 bottomed in 2009, ASML entered a powerful long-term bullish phase within the dark blue cycle, unfolding as light blue wave 3. Following this extended advance, the market transitioned into a corrective phase, forming bearish light blue wave 4. Notably, this correction ended with a truncation, indicating that bullish momentum returned faster and stronger than the market had anticipated.
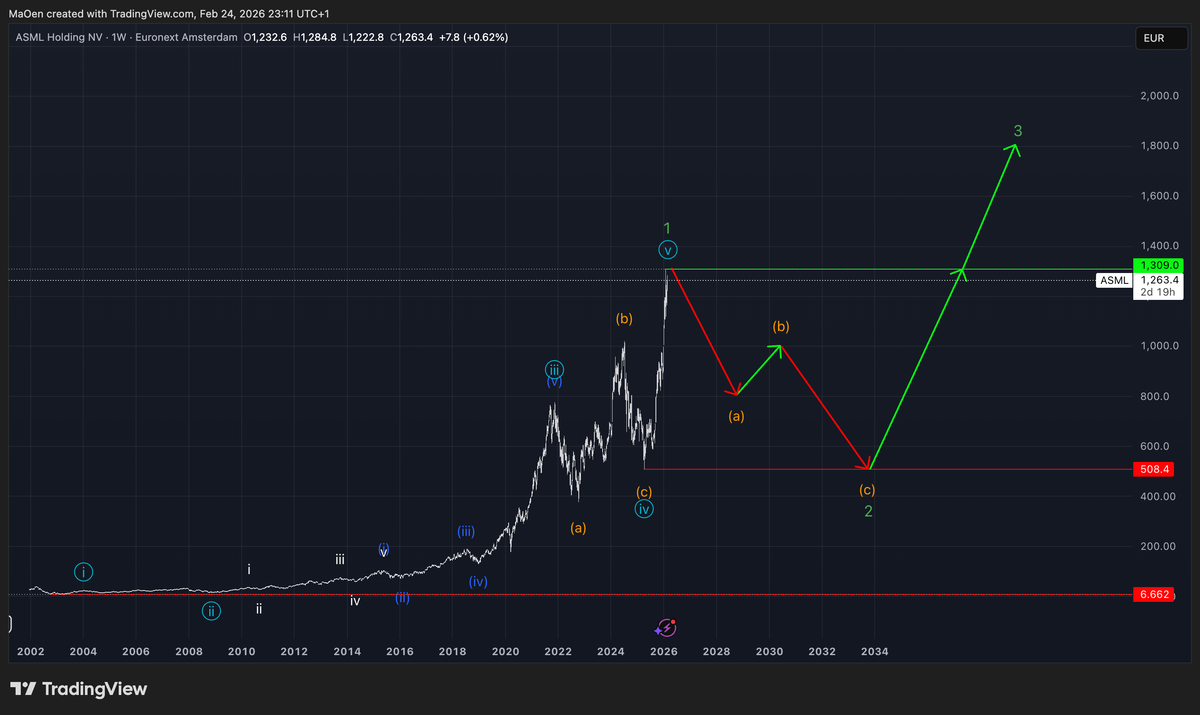
Upon completion of light blue wave 4, ASML resumed its upward trajectory with a strong impulsive advance. We expect this rally to develop into light blue wave 5, thereby completing the light blue cycle and initiating green wave 1 of a higher degree.
From a long-term Elliott Wave perspective, once green wave 1 is completed, a substantial corrective phase should follow, unfolding in an A–B–C structure as green wave 2. Under normal circumstances, we would identify a long-term Fibonacci retracement zone where this correction is expected to terminate, allowing bullish momentum to re-emerge and drive a major advance into green wave 3.
However, we do not believe ASML has already formed its major top. In our view, long-term green wave 1 has not yet been completed. To validate this assumption, we will now examine ASML from a narrower perspective using a smaller timeframe.

After the completion of light blue wave 4, ASML initiated new impulsive structures within the dark blue cycle on a lower degree. This dark blue cycle is now approaching its final stage. From an Elliott Wave perspective, we can identify an expanding wave 5 within the dark blue cycle.
The current all-time high at $1,309 marks only a local high, but in our view, it does not represent the major top. We expect the market to push higher and establish a new all-time high, completing dark blue wave 5, thereby finalizing the light blue wave structure and producing major green wave 1.
We anticipate that this major top will form within our projected Fibonacci price zone, which extends from:
- 61.8% at $1,393
- 100% at $1,561
Within this range, we expect the market to establish its major high and initiate the anticipated corrective phase into green wave 2.
Once the major all-time high is confirmed, we will be able to define a precise Fibonacci retracement zone where new buying or accumulation opportunities may emerge.
Should any structural changes occur, or if any of our Fibonacci zones are activated, we will provide an immediate update.
Kind regards,
Monalytics
DISCLAIMER: The content on this website, including charts, analyses, and recommendations, is for informational purposes only and does not constitute financial, investment, or professional advice. Trading and investing involve risk. You should consult a qualified financial advisor before making any investment decisions.