Apple (AAPL)
Apple before massive correction.
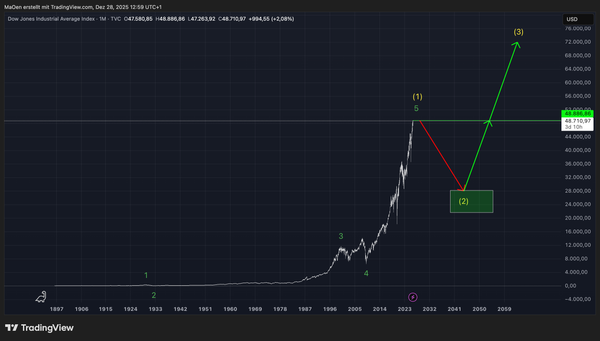
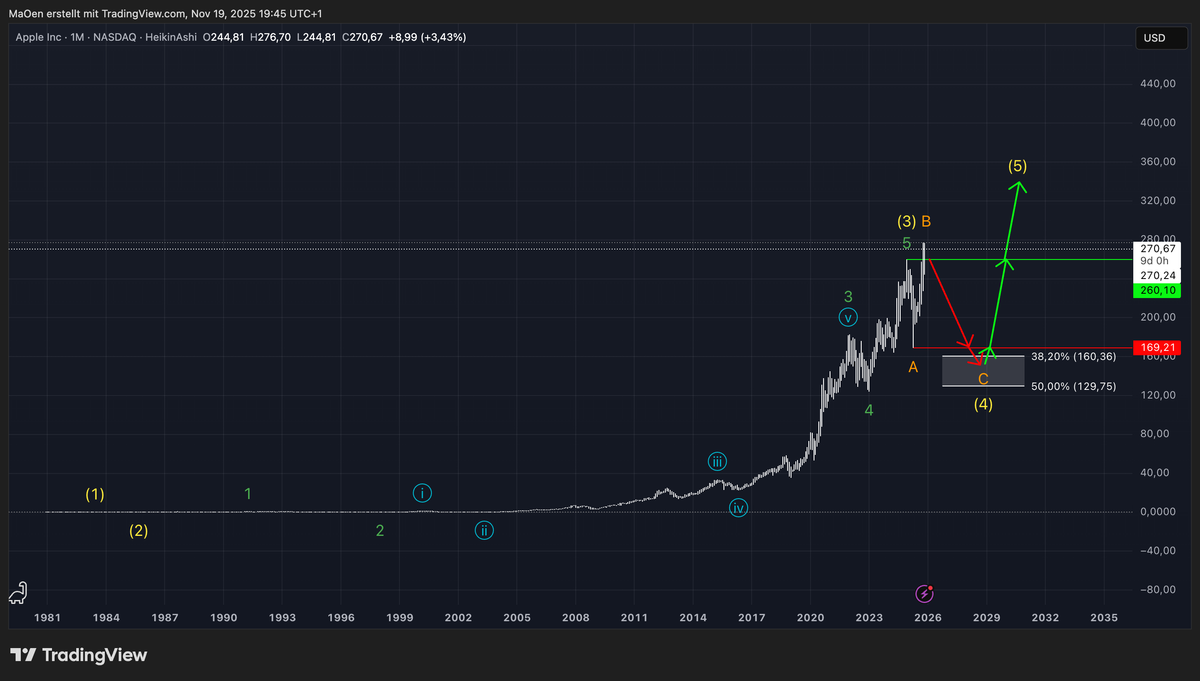
Since its initial public offering in December 1980, the company has developed a long-term Elliott Wave cycle (marked in yellow). After completing yellow Wave 3—a historically strong impulsive advance—Apple has now entered a corrective phase forming yellow Wave 4. This should represent the final correction within the broader yellow cycle before the long-term structure concludes with a terminal yellow Wave 5.
From a long-term perspective, we therefore expect Apple to continue correcting the completed yellow Wave 3 through yellow Wave 4, targeting our Fibonacci retracement zone between the 38.2% level at 160.36 USD and the 50% level at 129.75 USD. Once this retracement zone is reached, Apple would be positioned to initiate its final major impulsive sequence into bullish yellow Wave 5.
With our short-term outlook, we provide you with a more detailed wave count, which supports our primary long-term scenario. The short-term structure aligns strongly with the expectation of a continued corrective price action before the next major impulsive advance resumes.
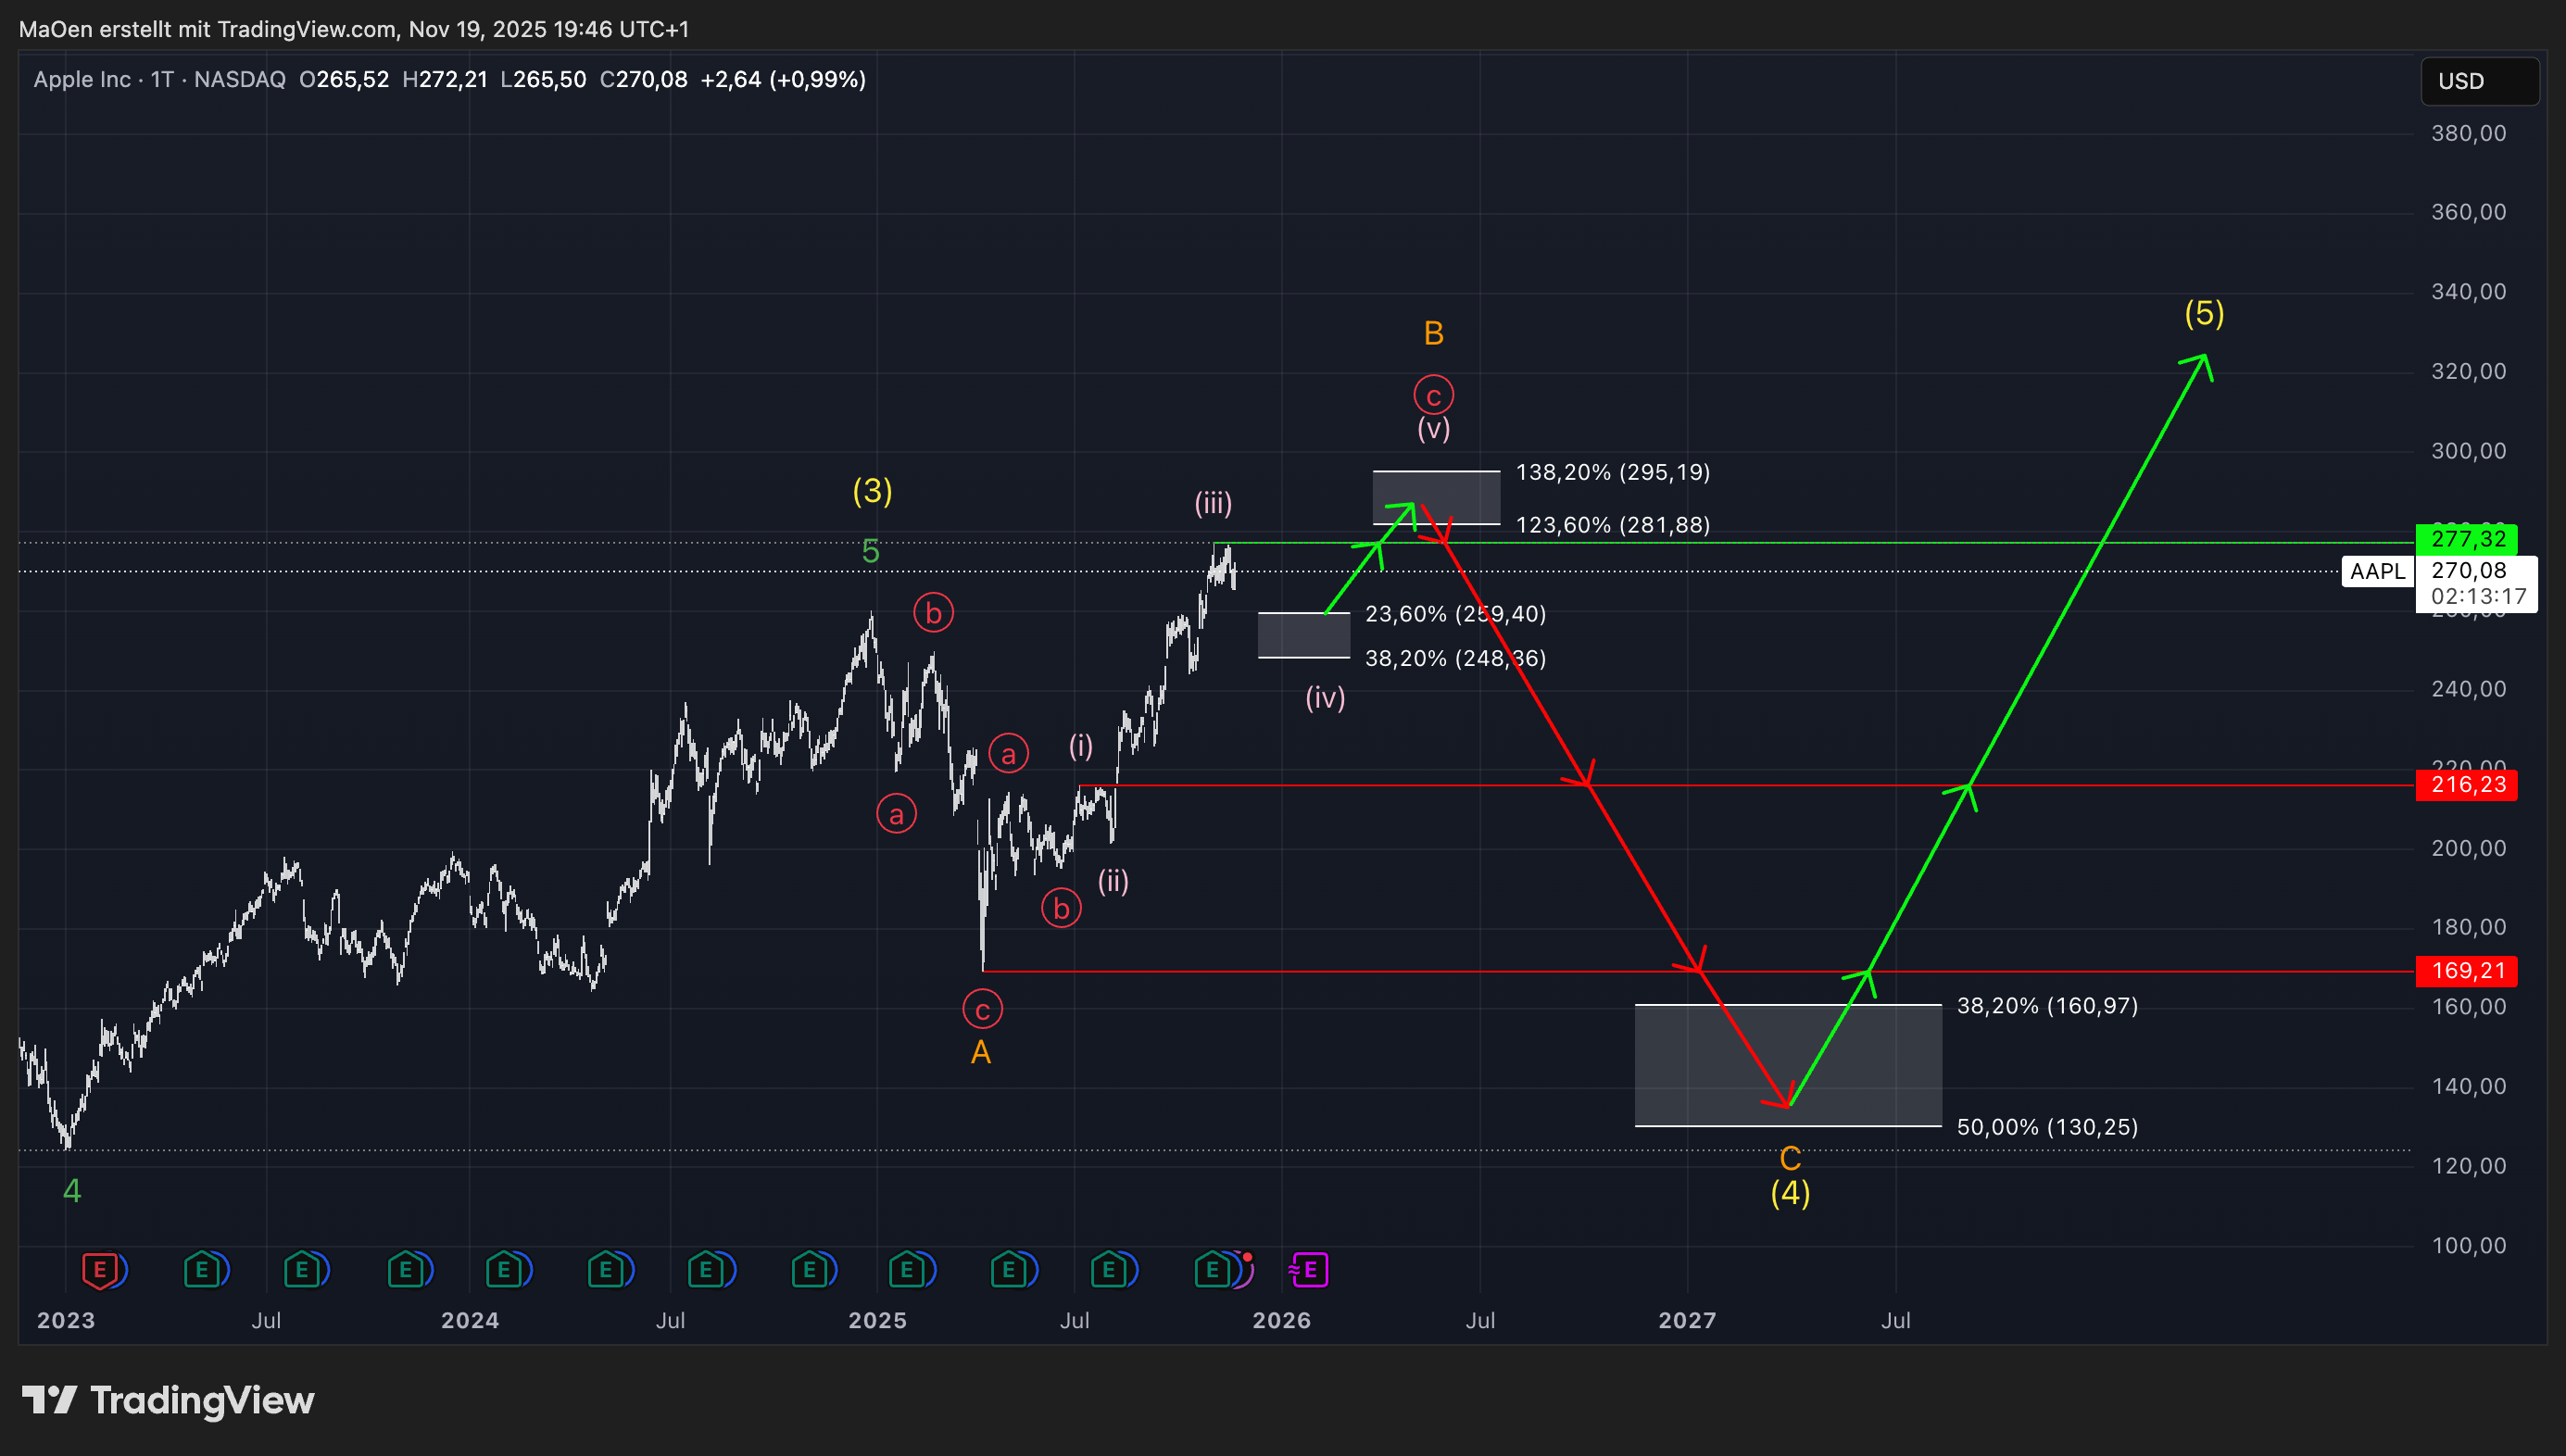
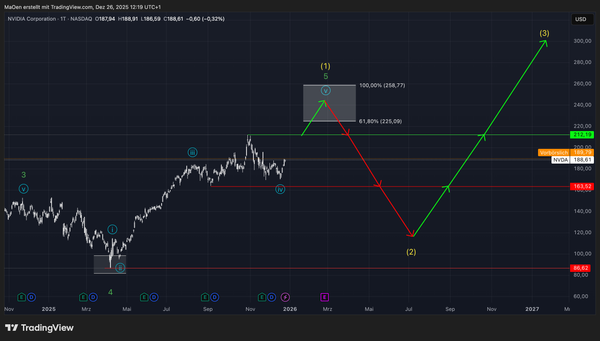
In our short-term scenario, we expect Apple to form an overshooting Wave B (in orange). For this anticipated Wave B extension, we have defined a shorting zone between the 123.6% Fibonacci extension at 281.88 USD and the 138.2% extension at 295.19 USD. Within this zone, we expect the overshooting orange Wave B to terminate, marking a transition from bullish momentum into a bearish reversal.
Before Apple reaches this shorting zone, we anticipate a minor corrective phase into pink Wave 4. For this pink Wave 4, we have projected a Fibonacci retracement zone that represents the last potential buying opportunity before Apple advances into the completion of orange Wave B. This retracement zone spans from the 23.6% level at 259.40 USD down to the 38.2% level at 248.36 USD.
Trading Plan:
This retracement zone provides a potential long-entry area, with long positions ideally being closed once price reaches the defined short zone for the overshooting orange Wave B. Upon entering this shorting zone, we expect Apple to lose bullish momentum and begin a decline into our long-term Fibonacci retracement zone for yellow Wave 4, as discussed in our long-term scenario.
In summary, the short-term expectation is as follows: Apple first corrects into pink Wave 4 within our retracement zone, then rallies to new all-time highs as it completes the overshooting orange Wave B, within our shorting zone. From there, price should reverse and decline into our long-term retracement zone to complete the bearish yellow Wave 4, before initiating a new major impulsive advance into yellow Wave 5.
Overall, we remain structurally bullish in the long term, but short-term bearish, if Apple reaches our shorting zone.
We will provide an update immediately if any structural changes develop.